- There is now over a $1Trn of cleared NDFs traded every month in 2022.
- March and September 2022 were particularly notable volume months.
- This is against a backdrop whereby the uncleared NDF market has not really grown.
- BIS data suggests that over 16% of total NDFs are now cleared across the whole market.
- This is likely to significantly understate the true portion of the NDF market that is cleared.
- This is because some of the BIS data is made up of non-market facing trades.
SDRView
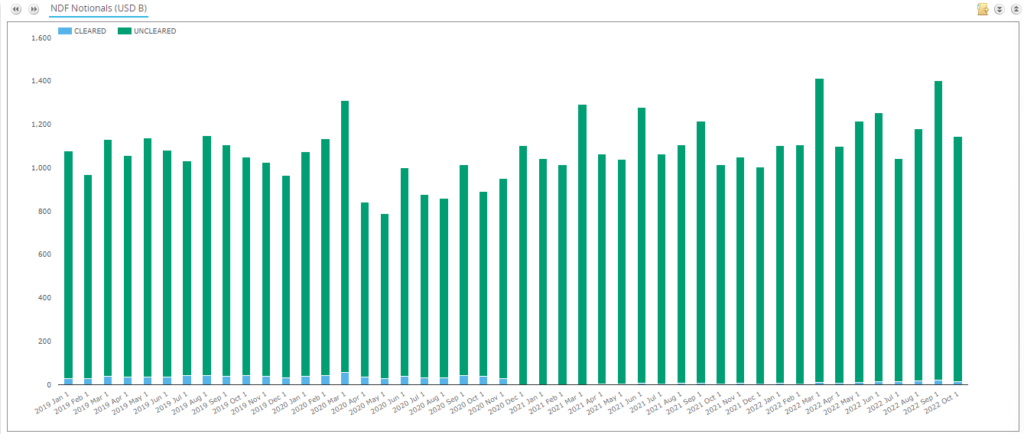
SDRView data suggests that NDF trading has turned into a bit of a “snooze-fest” in the past 3 years.
Showing;
- Monthly volumes of NDFs in 4 major currency pairs: BRL, CNY, INR and KRW versus USD.
- In 2019, average monthly volumes were just over $1Trn ($1,065Bn to be precise).
- In 2020, average monthly volumes were $988bn.
- In 2021, $1,099bn
- And so far in 2022, $1,196bn. Of which two months have seen the largest volumes in the past 3 years – March 2022 and September 2022.
- This is for activity of US Persons only.
In amongst all of our blog worthy content (Covid, NDF trading in Russia, Gilt mayhem) it appears that NDFs have been the only quiet place to hide in markets!
CCPView
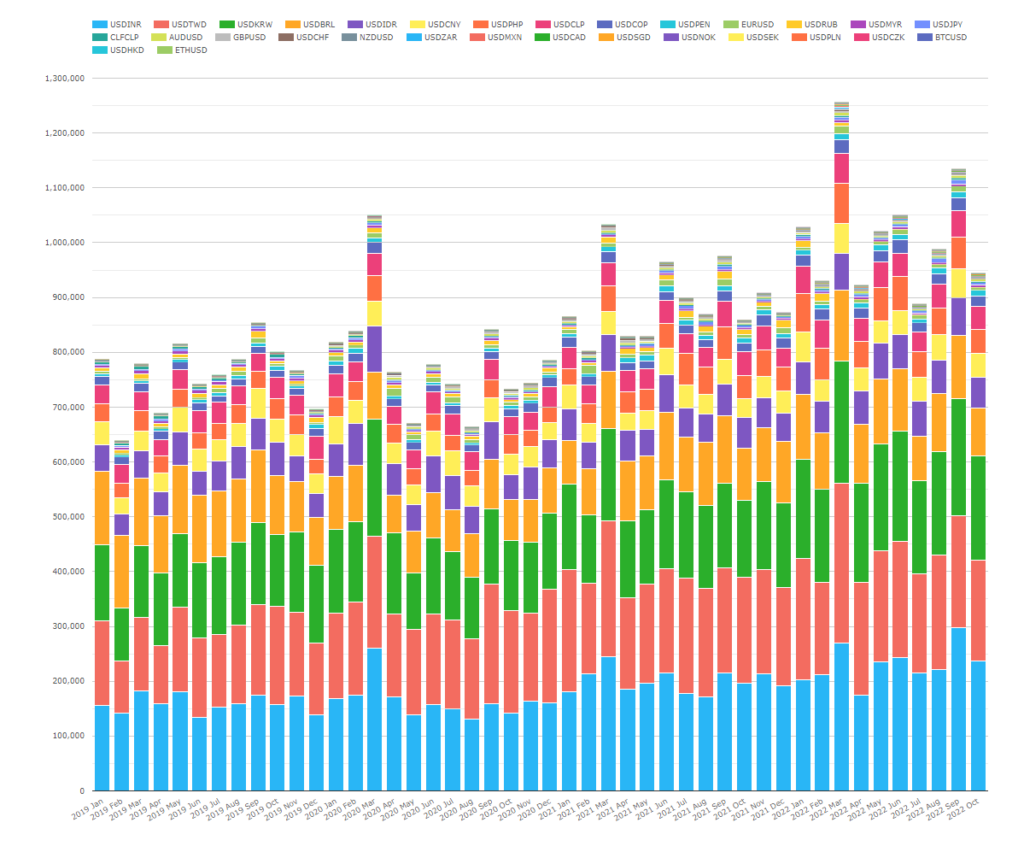
Turning to CCPView, which gives us a cut of the global cleared market, NDF volumes have grown at CCPs over the past 3 years. Looking at it per currency pair:
Showing;
- Monthly volumes in cleared NDFs across all currency pairs.
- Volumes are dominated by the largest four pairs (see SDRView volumes) – no surprises there.
- However, the evolution of volumes in the past 3 years is in quite a contrast to the underlying SDRView market.
- Whilst the US Persons market seems to have stagnated, Cleared NDF volumes have grown.
- In 2019, average cleared monthly volumes were $758bn per month.
- They have grown every year since (albeit the growth was pretty slow in 2020).
- So far in 2022, average monthly volumes are over $1Trn, at $1,014bn.
- That is 34% growth since 2019. Not bad compared to the underlying market.
I would guess much of this growth comes from:
- More NDF pairs being cleared.
- More counterparties looking at clearing as a result of NDFs being captured by the Uncleared Margin Rules (Phase 4, 5 and 6 counterparties I am talking about you!).
Does this mean that more of the NDF market is now cleared than ever before? Probably. Let’s run the numbers.
BIS Triennial Survey 2022
As I recently highlighted, we now have access to the “once-every-three-year-data-geeks-nirvana” that is the BIS Triennial Survey. Whilst much of the data that the BIS publish can now be replicated using more timely data sources (cough-“Clarus“- cough), it is very useful for monitoring the size of uncleared markets.
Given there is a sizeable element of the FX market still uncleared (which is putting it mildly!) – let’s see what the BIS data shows us.
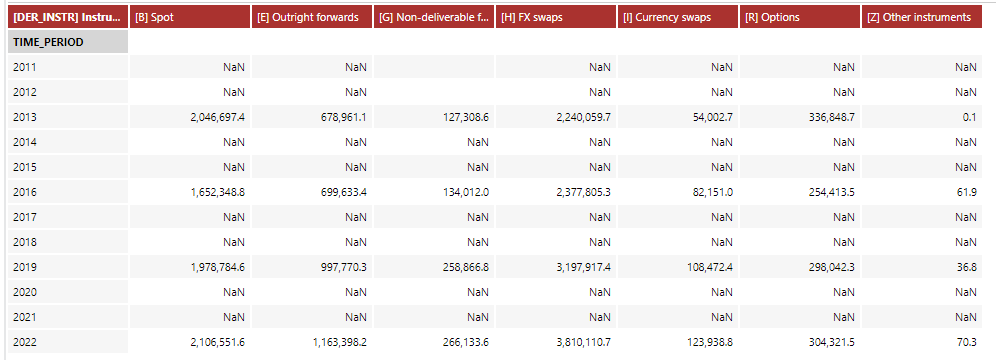
The fourth column “Non-Deliverable Forwards” shows us that:
- 2013 saw average daily volumes in April 2013 of just $127bn.
- In 2019, when we last looked at this data, that has climbed to $258bn – almost double the volumes reported from 2016.
- In 2022, this had increased only slightly to $266bn.
The BIS data therefore backs up the story told by SDRView data – the rate of growth in NDF volumes has significantly slowed since the 2016-2019 explosion in volumes. As we discovered last time out, whether this is down to changes in the underlying activity of inter-entity booking and/or how compression flows are reported will be an interesting avenue of study.
For now, let’s take it on face value.
Clearing
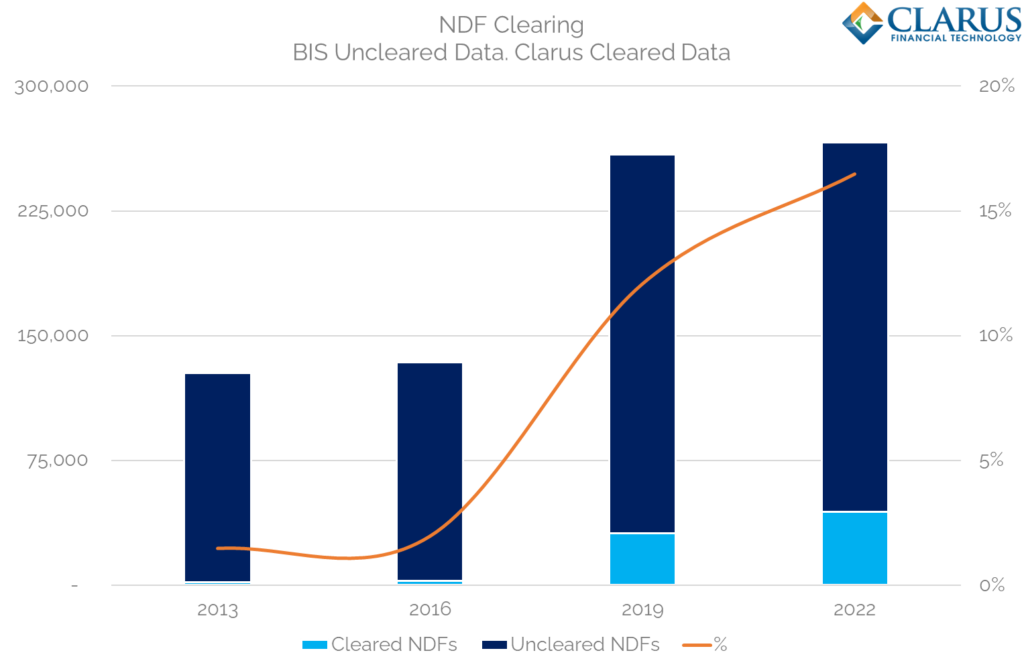
So what is new in Clearing in 2022? I would say it is the continued uptake of Clearing by more of the market. Looking at April volumes since our Cleared data begins in 2013:
Showing;
- Average Daily Volumes in NDFs since 2013 in both Cleared and Uncleared markets.
- Uncleared data comes from the BIS survey.
- Cleared data comes from CCPView.
- ADVs are available as an optional parameter in CCPView.
- In 8 years, clearing has increased from less than 2% of volumes to 16.5% of the overall market.
- (We take November 2014 as a proxy for April 2013 volumes).
As we saw underlying FX volumes sky-rocket higher from 2016 to 2019, we saw Cleared NDFs substantially outstrip the growth. This is likely as a direct consequence of the largest dealers becoming subject to Uncleared Margin Rules and moving much of the interbank volume to Cleared markets.
Since 2016, Cleared NDF volumes have continued to grow at a higher rate than the underlying market. Clearing has increased from 12.1% of the total market to 16.5% according to BIS data. That is a positive trend.
But Wait, Clarus Said that 30% of the NDF Market is now Cleared?!
Our astute readers would be right to call us up on that. The blog in question was written some six months ago:
In that blog I state:
- NDFs now see over $1Trn cleared in a single month.
- 28% of NDF volume has been cleared in 2022 according to the CFTC data, in a range from 24% to 34%.
So how does that possibly tie-in with this blog based on BIS data? It all comes down to understanding the data we are looking at. This latest blog on FX Clearing needs to be read in conjunction with the below:
That blog highlights that, unfortunately, BIS data is increasingly distorted by “non-market facing trades”. We prefer the CFTC data because:
- It is more timely (every ~two weeks).
- It is easier to understand the coverage.
- It has better granularity in terms of currency pair breakdown.
- It reconciles better with what we “hear on the Street” from CCPs and market participants.
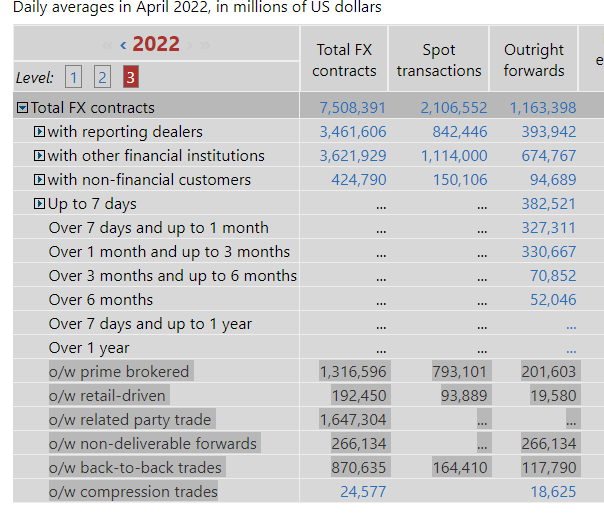
In terms of the BIS data as a whole, you can see the problem we are facing to sufficiently “cleanse” the data for non-market facing trades (think back-to-backs, prime broker legs etc). All of these metrics are measured at the “Outright Forward” level of data, and are not specifically stripped out for non-deliverable forwards:
Both sources unequivocally show that FX Clearing is becoming a larger portion of the market. That is the main story we believe.
And I didn’t even mention SACCR! Until next time…
In Summary
- Cleared NDF volumes continue to grow.
- BIS data is helpful for understanding the overall size of the uncleared markets, particularly for FX.
- However, the inclusion of non-market facing trades in the BIS survey likely distorts the picture.
- Cleared NDF markets are seeing all time record volumes against a backdrop of otherwise stagnant volumes.
- All of the data shows that Clearing is increasing in the market.
From your comment on the percentage of NDFs which are cleared, can i imply that means 50% of trades in the BIS survey “non market facing trades” and by that you mean the results of post-trade optimization and compression.
Your ratios are a bit out there, but certainly a significant portion of the FX volumes reported by BIS are related to back-to-back bookings and “related party trades”. That is not post-trade compression and optimisation though – that is a result of bank booking models, moving risk from different client-facing centres.
If you look at the top level FX numbers, out of a total $7.5Trn ADV, $1.647Trn is in “related party trades” and $0.87Trn in “compression”. That is 34% of the volumes that are not market facing. If we reduce the total NDF volumes by 34% as well (i.e. down from $266Bn to $176Bn ADV), our Cleared percentage already increases to 25% – which is nicely consistent with the original blog, and is a better reflection of what market participants tell us.