- March 2020 saw a flurry of volume records set in interest rate derivatives.
- The big SEF winners were ICAP, Bloomberg and Tradeweb.
- Overall, D2D On-SEF volumes for USD IRS hit a new record of ~$1trn.
- CCPs also saw new combined volume records.
- Over $50trn was cleared in the top six currencies alone.
- Over $4.5trn cleared in currencies outside of the top-six for the first time.
- CME and Shanghai Clearing saw notable increases due to increased volumes in Latam and CNY clearing.
Before I head onto the volume numbers, let’s analyse the market backdrop in the last two weeks by looking at USD Swaps.
USD Swaps
To begin, I want to update the previous COVID-19 blog on USD swaps.
In terms of volumes, SDRView Researcher shows that volumes have tailed off since we wrote that blog on March 25th:
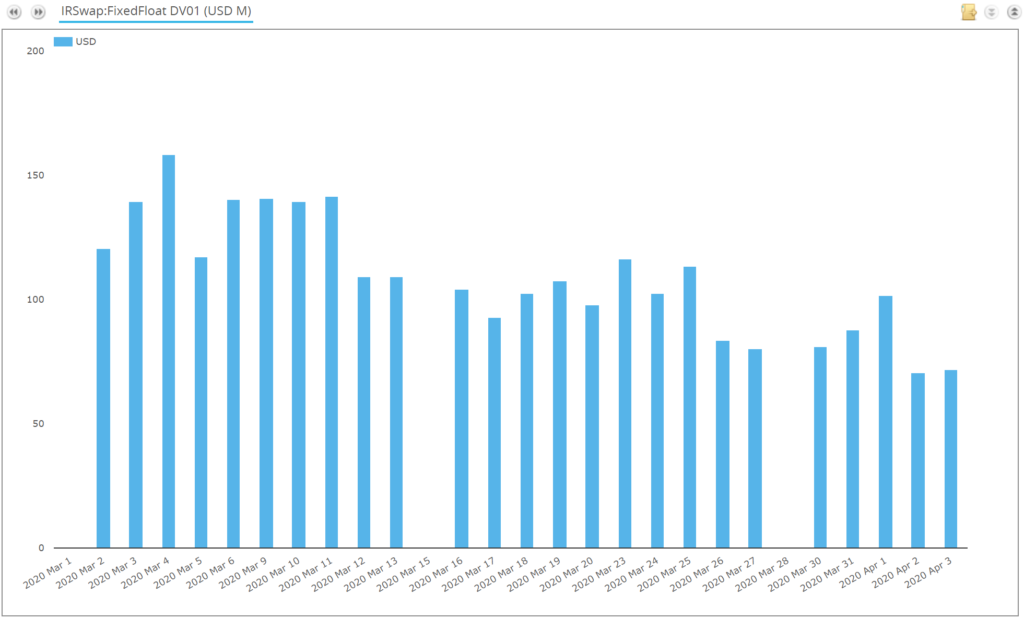
Showing;
- DV01 traded and reported by US Persons of USD swaps since March 1st 2020.
- April 2nd was the lowest volume day in this time period, with Friday April 3rd a close second.
- How does this relate to broader themes in the swap market?
This series of blogs seems to be showing us, more than ever, that traded volumes are very closely linked to volatility. We can see that the intraday range of prices has been slowly trending tighter in recent trading sessions:
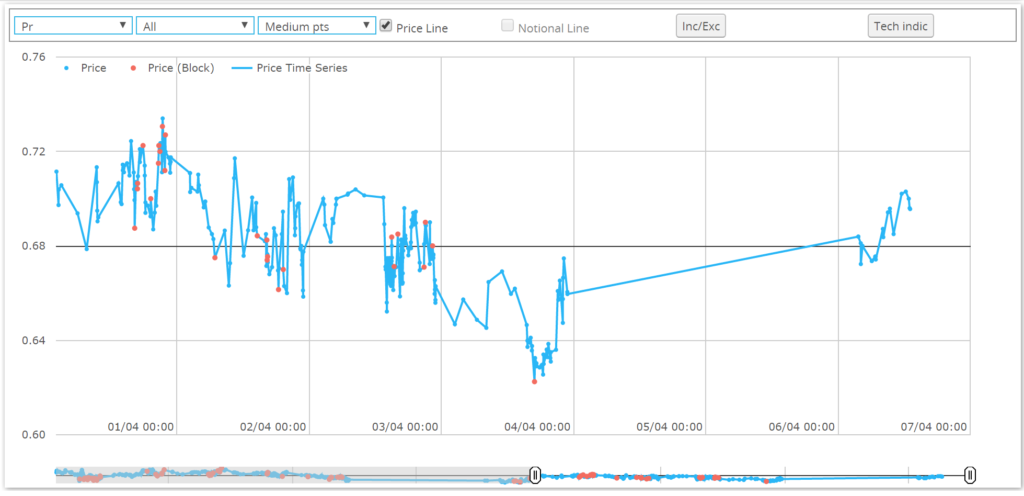
So far in April, 10Y USD Swaps have traded within a 10 basis point range. I’m sure that this reduction in intra-day volatility comes as quite a welcome respite to the market.
This is also highlighted by our choice of liquidity measure, Price Dispersion. We find in 10Y USD swaps that price dispersion has reduced back to February levels:
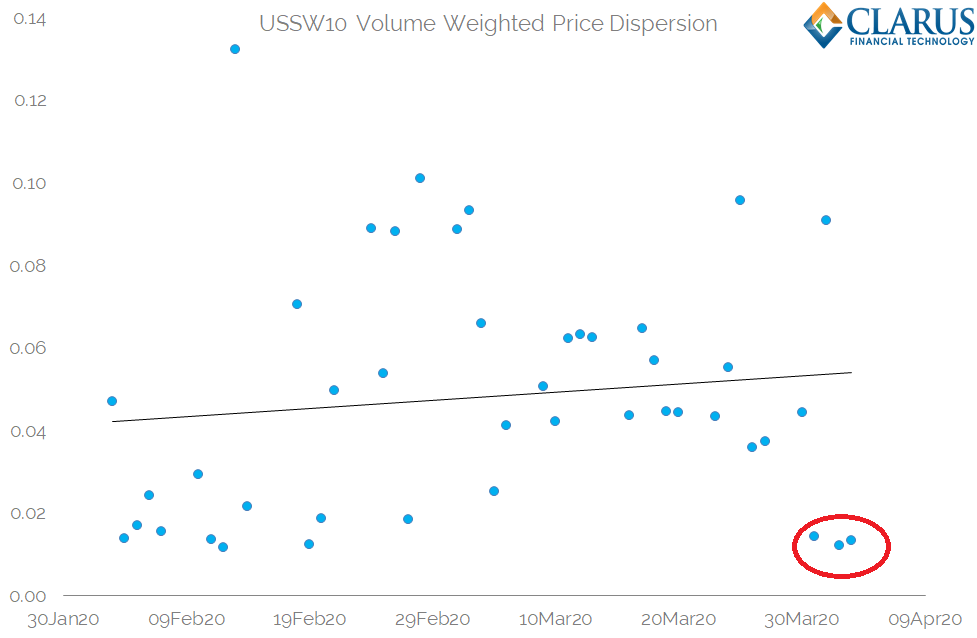
- This is the volume-weighted difference of all 10Y swap trades to the average price printed on that day.
- In terms of monitoring “liquidity” we expect a more liquid market to have a lower price dispersion than a less liquid market.
- This measure of price dispersion can also be impacted by intraday volatility (more intraday volatility = higher price dispersion).
- The chart clearly shows that price dispersion has reduced to more typical levels.
- This suggests that liquidity is getting back to normal in USD swap markets.
SEFs
Now let’s dig into the volumes. First up, SEFs. Looking at SEFView reveals the biggest surprise from the past two months: the combined market share of D2C SEFs in USD Swaps hit a 2020 high.
Showing;
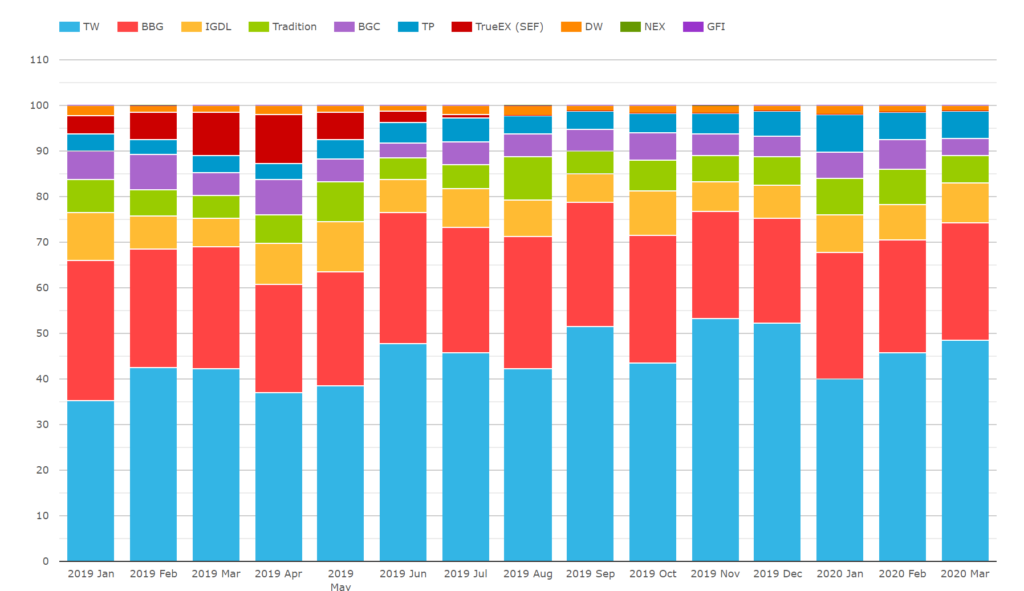
- Market share per SEF in vanilla Fixed-Float USD IRS as measured by notional amounts.
- March 2020 saw 70% of USD IRS transacted on a D2C SEF. That is not a record (March 2019 saw 75%), but it was higher than January and February 2020 (61% and 64%).
- This somewhat surprised me, as I would expect compression and list trading activity to be substantially down in volatile markets.
- I also expected dealers to need to re-balance portfolios just as much as customers, if not more. Maybe with dealers on one side of every customer trade there has been more offsetting flow?
This isn’t to say it was a bad month for the D2D SEFs! In fact, it was the highest volume month on record for D2D SEFs:
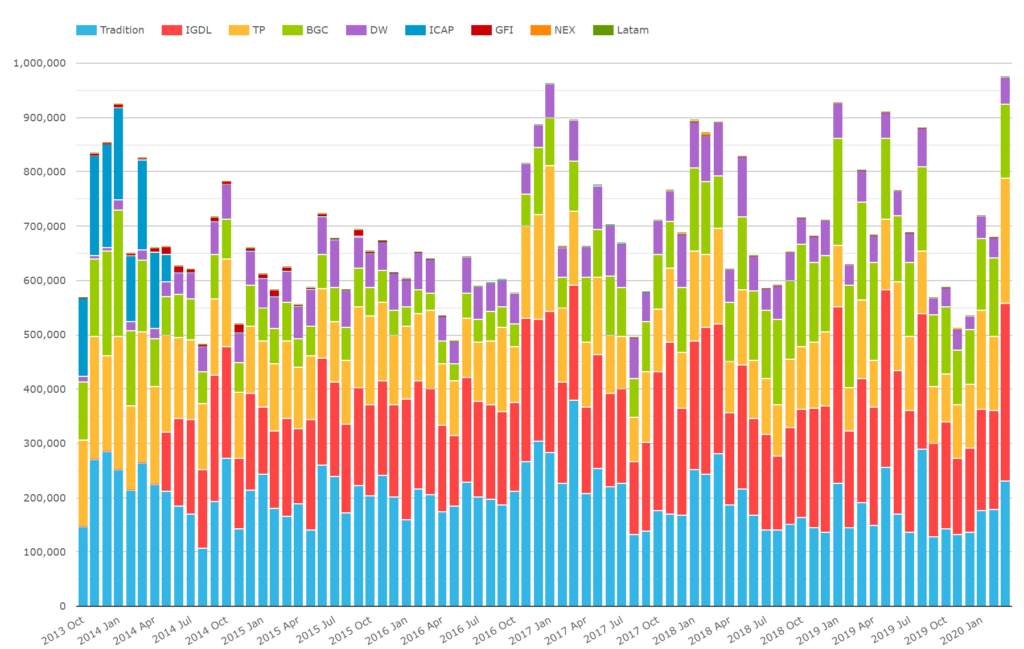
Showing;
- USD IRS fixed-float volumes in millions of notional. Almost $1trn transacted on D2D SEFs last month.
- In March 2020, we saw ICAP with a 33.5% market share. This was up from 27% the prior month.
- Trads saw a 24% market share, in line with prior months.
- TP was pretty constant at 24%.
- BGC saw a fall, to 14%, down from 21% the prior month.
In USD swaps trading, it therefore looks like Tradeweb, Bloomberg and ICAP were the big volume winners.
Cleared Markets
Now lets take a look at the volumes across the global cleared markets. These cover all market participants, not just US Persons, thanks to CCPView.
Major Currency Cleared Volumes
First off – this was a record month ever for volumes across USD, EUR, GBP, JPY, AUD and CAD Rates markets:
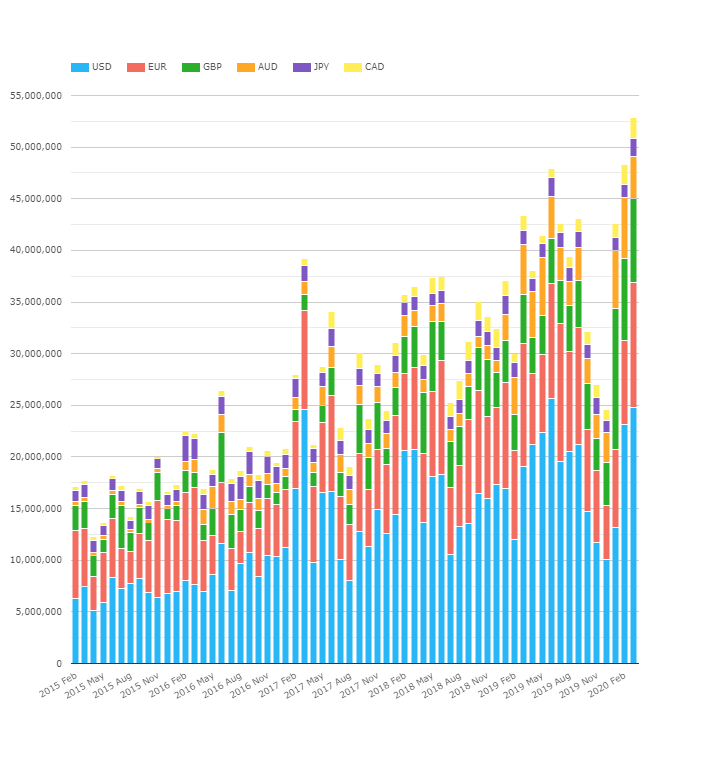
Showing;
- Notional amounts in millions of USD equivalent cleared across all cleared Rates products, excluding FRAs. Including FRAs also shows a record.
- This is the first time that these six currencies have breached $50trn cleared in a single month.
- Interestingly, it wasn’t a record for USD volumes alone. June 2019 remains the only month to pip $25trn cleared in USD swaps in a single month.
- And in fact it wasn’t a record month for EUR, nor JPY, nor GBP, nor AUD!
- Interesting how the crisis has caused large volumes due to elevated volumes across all major currencies. This highlights how global the shock has been.
- In terms of CCP market share, LCH actually recorded a slight dip (from 95% to 94%). I was surprised as I thought all liquidity would rush to a single CCP.
Cleared Volumes in Other Currencies
As we watch this crisis unfold, one of the defining features has been the rush to USD as the “global reserve” currency, and the resulting flood of USD offered to the market from the Fed.
This is consistent with investors seeking to “repair” portfolios which have suffered huge USD-denominated losses. Is this a pre-cursor for lots of defaults on USD-denominated debt, such as we saw in the GFC?
We do not yet know the answer, but it nonetheless piqued my interest to look at non-USD currencies in swap markets. Are USD swaps “sucking” liquidity from smaller currencies?
The data suggests otherwise. From CCPView, we see record volumes in the “non-major” currencies:
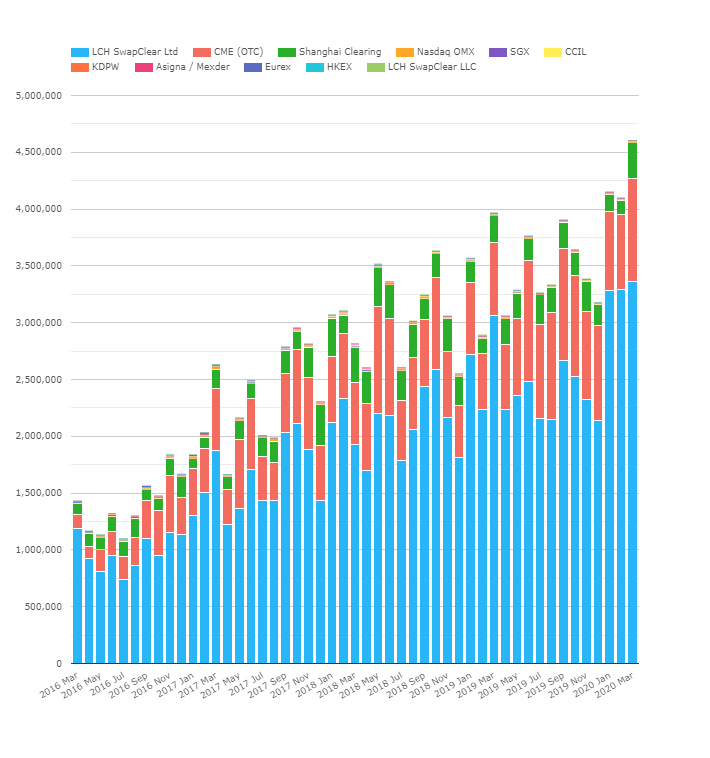
Showing;
- What a chart! It’s like an escalator, the ever-increasing volumes of cleared swaps in the minor currencies.
- This chart includes 20+ currencies, excluding the six “majors” (in terms of cleared volumes) – USD, EUR, AUD, GBP, JPY, CAD.
It is interesting to see the market share changes between CCPs from February to March 2020:
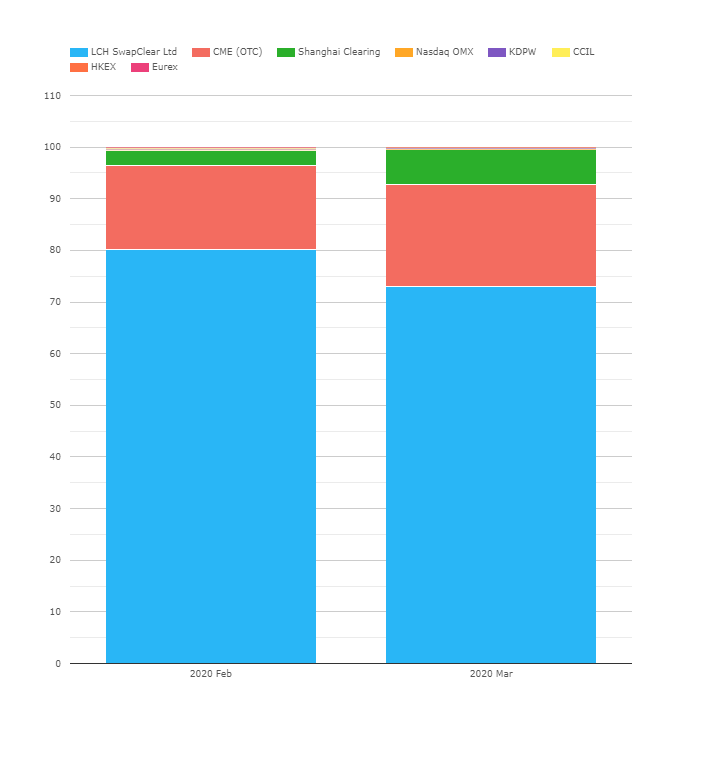
- CME market share of these non-major currencies increased from 16.2% to 19.7%.
- Shanghai Clearing market share increased from 3% to ~7%.
- The market share of LCH actually decreased among these currencies from 80% to 73%.
- This suggests that the larger increases in volumes, relatively speaking, have been in Latam (CME) and CNY (Shanghai Clearing) rather than European currencies where LCH is strongest.
In Summary
- Elevated volatility during March 2020 led to huge trading volumes.
- As the crisis has evolved we have seen intraday volatility begin to reduce back to more typical levels.
- The volatility has led to record volumes in a number of areas.
- D2D SEFs saw ~$1trn of activity in USD IRS alone.
- Over $50trn cleared in Rates markets in the six largest currencies. 94% of this was at LCH SwapClear.
- CME and Shanghai Clearing both saw an increase in market share in minor currencies.
- Global cleared volumes in minor currencies surpassed $4.5trn for the first time.