- Trading shrank by about 20% to $5.2Trn per day in Interest Rate Derivatives from April 2019 to 2022.
- Transition to RFRs has resulted in a $1.4Trn reduction in daily activity in FRAs alone, explaining much of the decline.
- The BIS survey occurred when markets were likely experiencing a degree of heightened activity, although Clarus data shows that this was far from unusual in the past 24 months.
- The BIS have shed transparency on the size of the non-market facing portion of activity, which may account for over $2Trn every single day.
BIS Derivatives Volumes in April 2022
The latest BIS survey data is now available. Performed once every three years, it provides a snapshot of daily trading volumes across FX and Interest Rate markets.
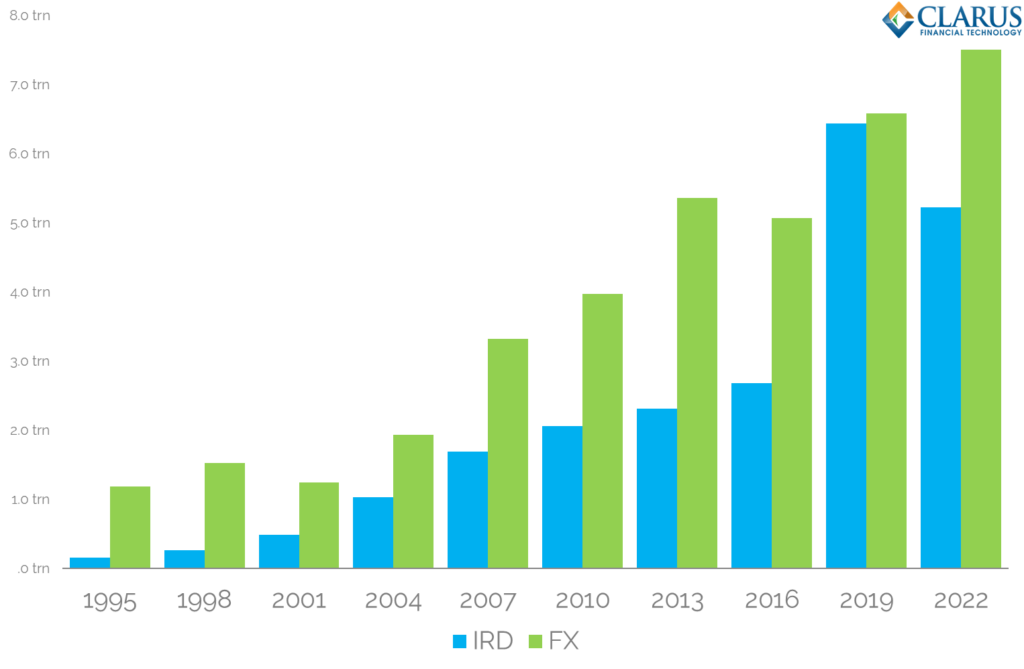
Last time out, back in April 2019, it was Interest Rate Derivatives that made all the headlines. Average Daily Volumes (ADV) were $6.5 Trillion (trn). IRD volumes had sky-rocketed since 2016 when volumes were closer to $2trn per day. This brought notional volumes traded in IRDs equal to FX derivatives for the first time.
April 2022 saw another record in ADVs for derivatives, but this time all of the growth was in FX derivatives. IRD volumes have shrunk for the first time ever in these surveys. This decrease in IRD activity is largely in response to the transition from IBORs to RFRs.
To be clear, the transition to RFRs has caused a difference in the type of product being traded. There is no need to trade FRAs in an RFR world, resulting in a reduction in FRA ADVs from $1.9Trn in 2019 to just $0.5Trn in 2022.
That $1.4Trn reduction in FRA volumes is actually larger than the overall decrease we have seen in ADVs for Rates:
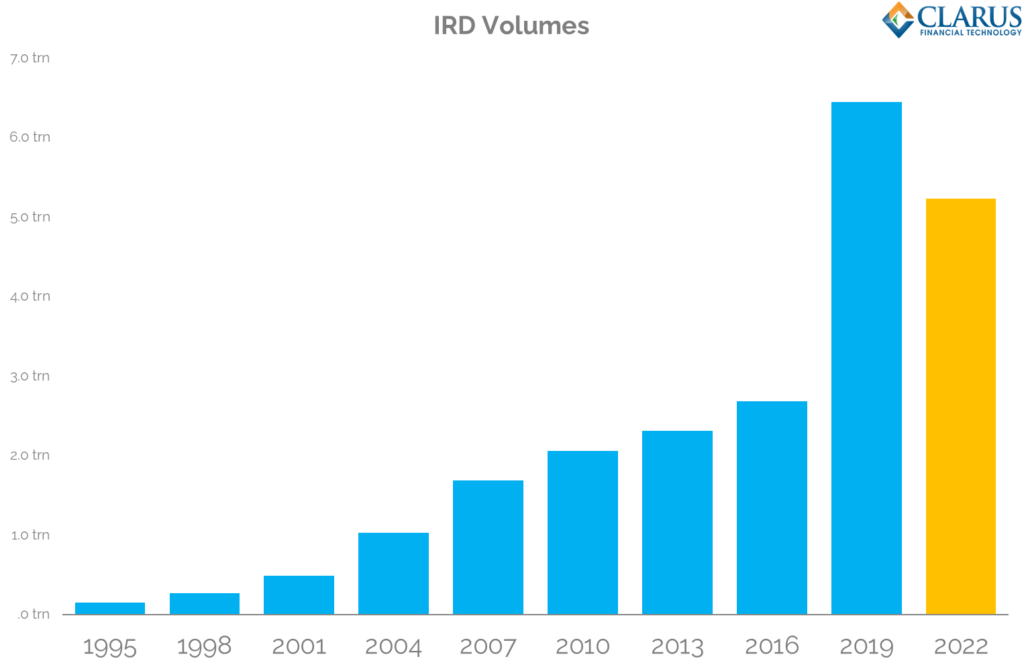
- Volumes were $6.5Trn per day in April 2019.
- This has reduced to $5.2Trn in April 2022.
- This remains way higher than activity in 2016 ($2.7Trn).
- The $1.3Trn reduction in ADVs since 2019 is mainly explained by the reduction in FRA activity.
This latest data does mean that Interest Rate markets are once again outstripped by FX markets in terms of daily notional turnover:
The BIS suggest that market conditions since 2019 have been a LOT more volatile. I think we would all agree!
The BIS further explain that April 2022 trading was characterised by geopolitical tensions around the Russian invasion of Ukraine, as well as worries over increasingly persistent high inflation with central banks around the globe hiking rates. It was, however, before the “gilt shock” of recent markets and the transition to even higher rates.
It is therefore possible that April 2022 saw more elevated levels of underlying activity than would be associated with a “typical” (normal?) period. This of course highlights the limitations of using a snapshot in time to measure activity, rather than monitoring volumes daily/weekly/monthly.
However, the ISDA-Clarus RFR Adoption Indicator shows that April 2022 was actually the lowest volume month this year for Interest Rate Derivatives. If anything, markets were “taking a breather” in April – as we looked at in our commentary at the time.
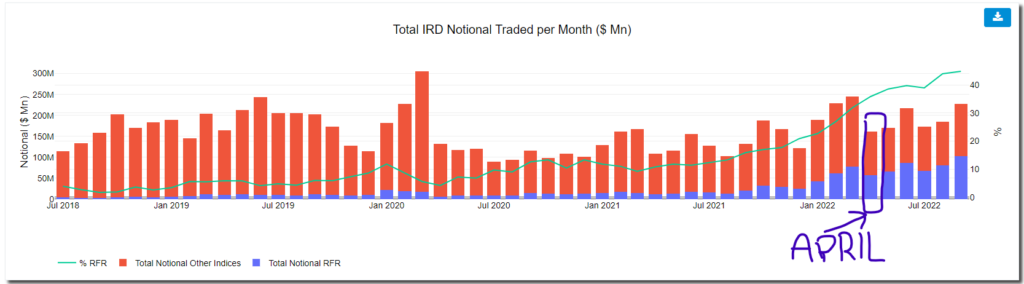
Therefore, whilst the market backdrop likely caused more trading (as seen by the increase in FX activity), other months this year would have shown even higher levels of activity. Yes, IRD notionals traded have reduced since 2019, and it is likely the reduction would have been even larger if the underlying markets had been less volatile.
What has changed in the survey?
The previous 2019 version of the BIS report was characterised by a large increase in “non-market facing trades”. This was stated in the BIS data commentary, and was not previously broken out in the data.
That didn’t stop particularly enterprising data geeks from trying to estimate how much compression had “inflated” the BIS data. This report for CCP12, written using Clarus data, shows that we thought the 2019 figures included nearly 50% of volumes related to non-market facing trades.
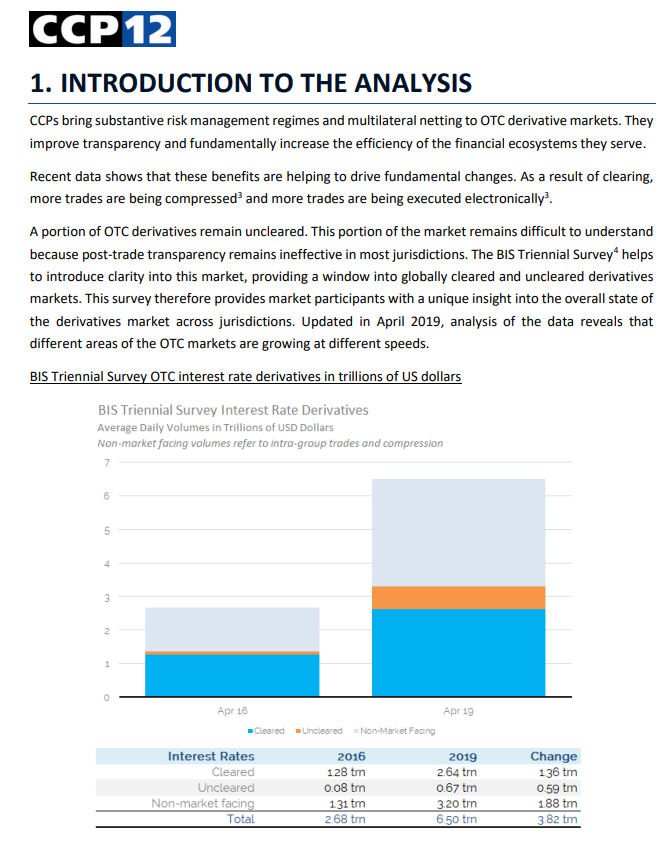
Now, we have the actual answer from the BIS. We would like to thank them (and the reporting dealers) for recognising that this is an important element of the data and for taking the time and effort to improve the data being published. It substantially improves the transparency in derivatives markets. The raw data is intriguing:
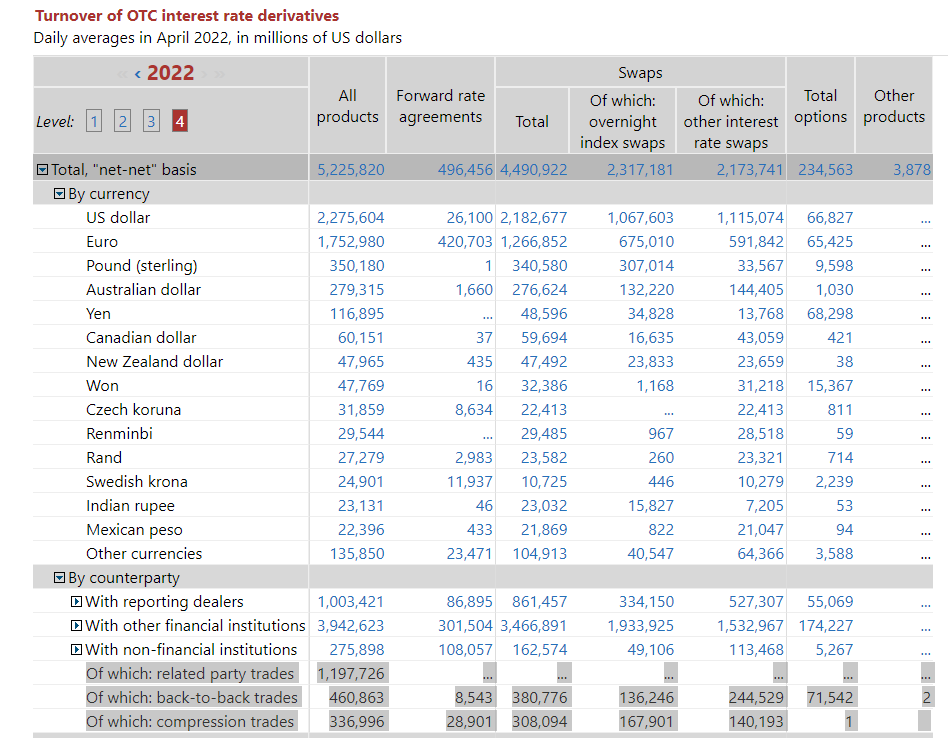
At Clarus, we also concentrate on “price-forming” volumes. This is why we rarely include FRA volumes in our analysis. The BIS have gone one step further and defined 3 different types of non-price forming trades:
- Related party trades- These have been published for a while, and have declined slightly from $1.4Trn in 2019 to $1.2Trn in 2022. We tend to exclude these in our analysis of BIS stats.
- Back-to-Back trades – I think we can all agree that these are non-price forming!
- Compression trades – economically equivalent trades being compressed either into new positions or moved between counterparties should not be considered price-forming.
You’ll notice in the below chart that the BIS only consider some of the FRA volumes as non-price forming. We tend to go further as 95%+ of these volumes are transacted via broker run “volume matching sessions” with a pre-published mid-market curve.
In terms of “price-forming”, we would tend to remove:
- $1.2Trn of related party trades
- Plus $461Bn of back to back trades
- And $337Bn of compression trades.
Overall, that would suggest at least $2.0Trn of volumes every day are non-price forming in IRDs! If you include FRAs as well, that is more like $2.5Trn! Therefore, between 38-48% of volumes are non price forming in Rates derivatives.
This is somewhat lower than we estimated in 2019. It will be interesting to monitor this over the years as:
- Brexit changes booking models. Will there be more “related party trades” as European hubs move risk back to the parent for risk management?
- SACCR for leverage ratio moves regulatory capital to a risk sensitive model, rather than gross notional based. Will this reduce the industry obsession with compression?
- The GSIB regime continues to have an element of sensitivity to gross notional. Will this continue to motivate use of compression and back to back trades?
It will be nice to see regulatory capital drivers coming through in the data. Thanks again to the BIS for increasing transparency.
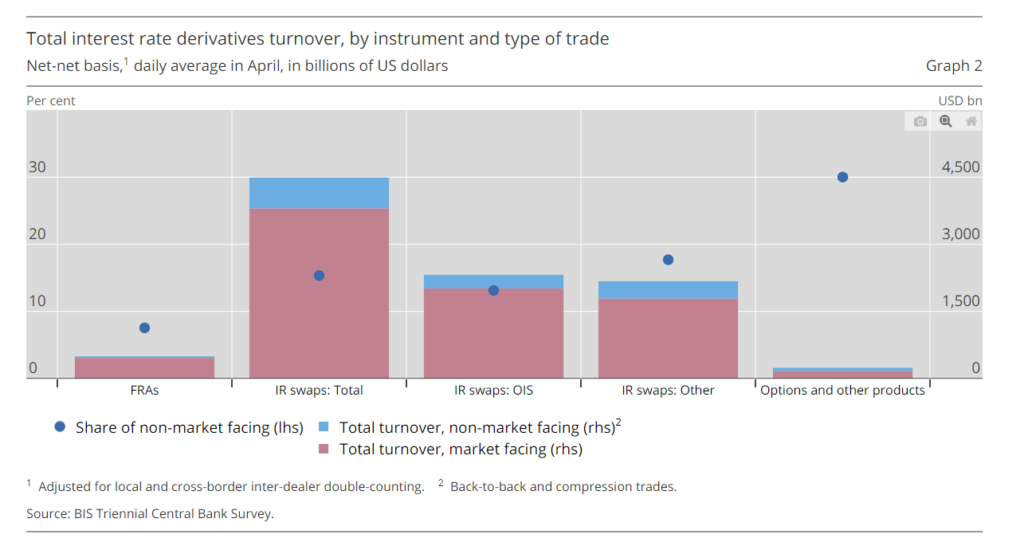
The 2022 Survey introduced new dimensions to more cleanly separate “market-facing trades”, ie deals with customers and other unrelated entities that contribute to price formation in the market. This was in response to the outsized growth in turnover in the 2019 Survey (Graph 1), when dealers in several reporting jurisdictions noted that “non-market-facing trades” contributed significantly to turnover. These include compression trades.
OTC interest rate derivatives turnover in April 2022
What Does the Clarus Data Show?
To sanity check the BIS data, we can use CCPView for Interest Rate Derivatives – this can be expressed as ADV using our drop-down options:
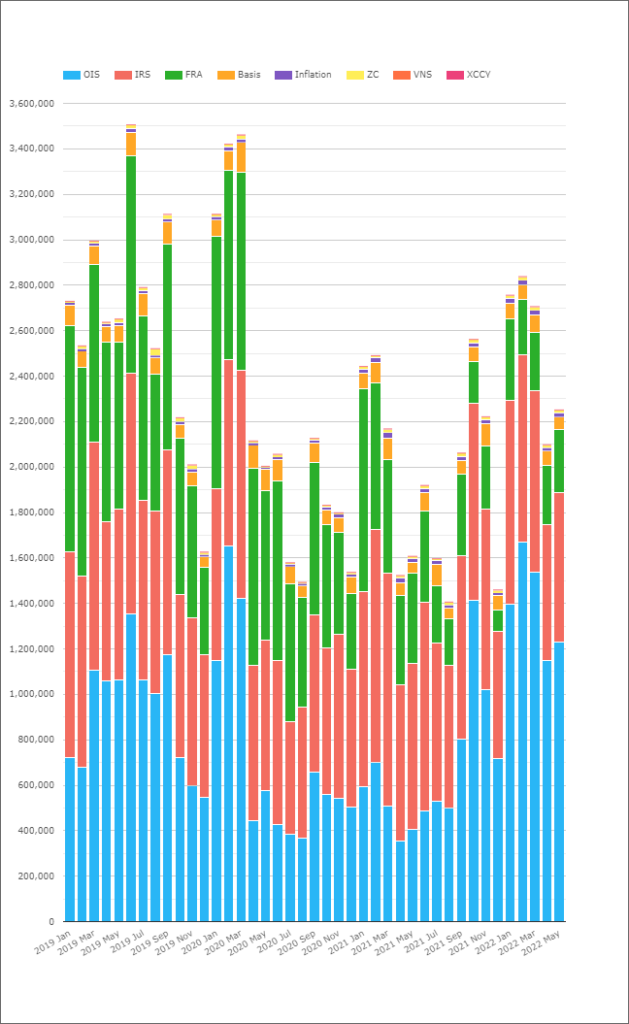
Showing;
- Our monthly volumes from CCPView expressed as Average Daily Volume per month per product.
- In April 2019, CCPView recorded ADVs of $2.6trn.
- In April 2022, CCPView recorded ADVs of $2.1trn.
- These totals are lower than the BIS data because we look only at Cleared volumes. The difference ($3.13trn) is the combination of uncleared derivatives and non price-forming activity.
- In terms of growth rates, our data shows that cleared trading activity reduced by 20%.
- This is pretty much in-line with the BIS survey showing a 19% reduction in total volumes.
On a product basis, FRA ADVs in clearing reduced from a $792bn ADV in 2019 to $261bn in 2022 – a far smaller decrease in activity than seen in BIS figures. This is intriguing as virtually 100% of FRAs have been cleared for some time.
Pulling the data together leaves us with the following high-level overview:
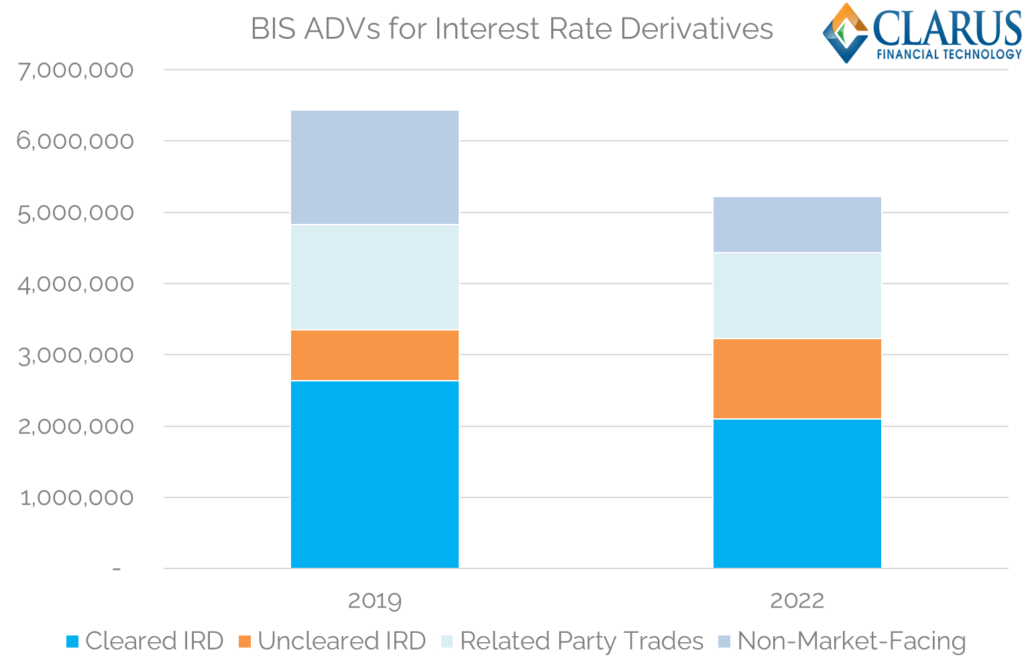
I think that is a pretty neat way to summarise our market right now. It shows that:
- Activity in Cleared IRDs was $2.1Trn in April 2022 (single counted). This was 20% lower than in 2019.
- Activity in Uncleared IRDs actually increased – from $712bn in 2019 to $1.13Trn in 2022.
- This growth in Uncleared markets assumes that all of the non-market facing activity reported by the BIS remains uncleared. That is maybe an overly simple assumption given that some compression trades will certainly be cleared.
The analysis reminds us that it remains difficult to get decent transparency for the uncleared portion of markets. SDRView helps, but this is only for the US Persons portion of markets. Hopefully, Europe and other jurisdictions will eventually follow suit.
In Summary
- Activity in Interest Rate Derivatives shrank by around 20% over the past 3 years, to sit at $5.2Trn per day.
- This decrease in activity is shown in the latest BIS Triennial Survey and further explained using Clarus CCPView data.
- For the first time we have BIS transparency into compression and back-to-back volumes, which is very welcome.
- It is evident that transition to RFRs has impacted traded volumes.
- There is no evidence that this transition has impacted liquidity.
- Rather there is far less activity in FRAs. This is due to the less complex risk management requirements of RFR trading.