- OIS trading is seeing increasing activity in longer tenors in both USD and GBP.
- We look at tenor data out of LCH SwapClear to present the volumes in DV01 terms.
- We find that the amount of long-dated risk traded in 2018 is 2-3 times higher than in 2017.
Our series on Risk Free Rates, looking at how the market will move away from Libor, focuses on measuring how and when the market will move. We’ve already introduced CLARUS01 to help the market transition.
It is therefore important to track this transition. The simplest way is to look at the percentage of risk that is traded as an OIS and how much as a Libor-based swap. We’ve looked at those metrics via SDR data a few times in the past.
Today, I’ll take a slightly different approach. SDR data, after all, only captures US person trading. It is a decent insight into that portion of the market, but we have a better data set via CCPView. This provides global coverage of all cleared volumes.
I’ll take a look at OIS cleared at LCH for both GBP and USD. We have recently added tenor data to CCPView, so we now know what tenors are being cleared at LCH SwapClear. With SwapClear enjoying a 98% market share of cleared OIS, this gives us a great overview of the global OIS market and the emerging trends.
GBP SONIA Trading at LCH
First off, let’s take a look at how much SONIA (GBP OIS) trades at LCH and across which tenors. First, on a notional basis from CCPView:
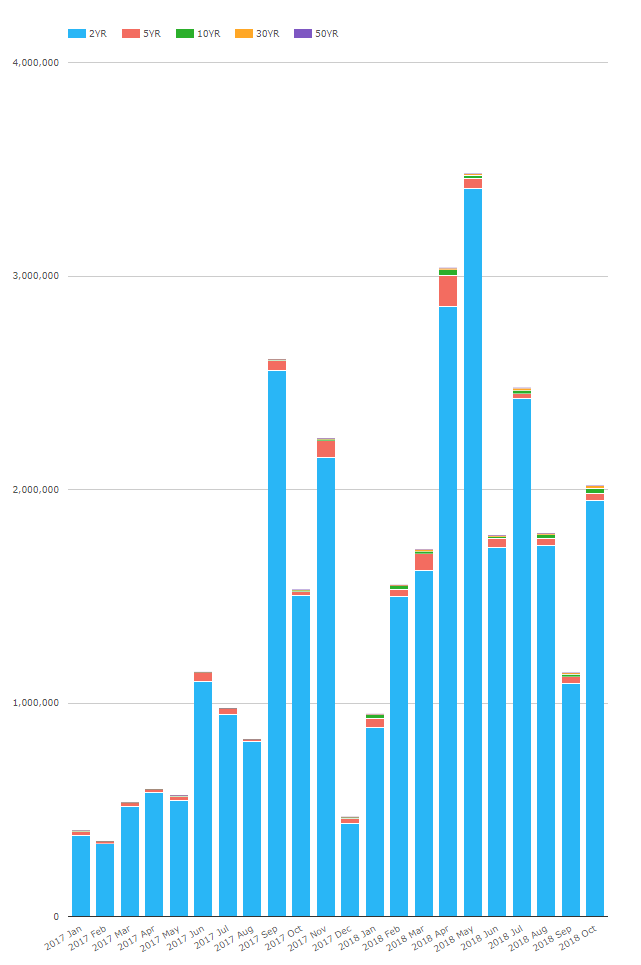
- Monthly volumes have been steadily increasing since 2017.
- 2018 SONIA traded volumes are already 73% higher than last year.
- When measured on a notional basis, most volume is clearly in the 2 year (and under) bucket.
- This means that our view of the market using the above data could be heavily skewed by including 1 month trades linked to MPC dates and hence speculative trading on central bank moves.
I therefore exported the data and used our microservices to translate the volumes into DV01 figures instead. This gives us a maturity-agnostic view of the risk being traded. It is also incredibly simple to do via a single call to our microservices:
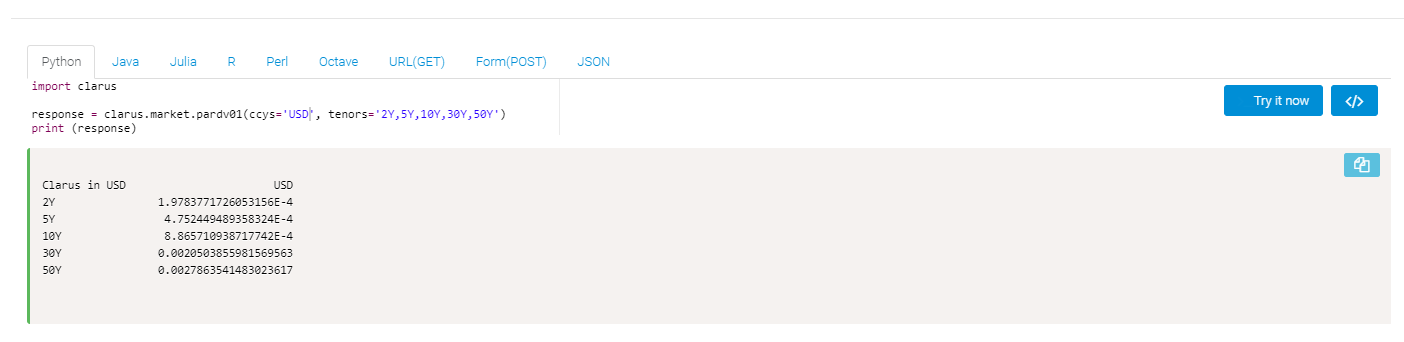
My python call is replicated below, showing the par DV01s for the appropriate tenors in CCPView:
import clarus

response = clarus.market.pardv01(ccys='GBP', tenors='2Y,5Y,10Y,30Y,50Y')
print (response)
Armed with the data, I can now go off and analyse the trends:
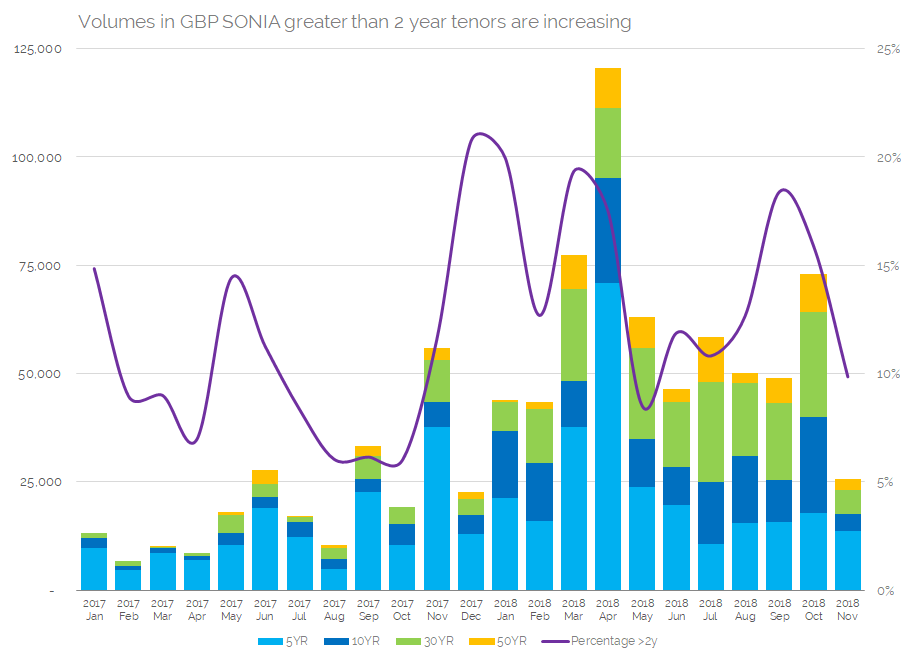
- DV01 of GBP SONIA cleared at LCH each month for tenors 5y through to 50y. DV01s measured in £1,000s.
- We exclude the 2y data to focus on longer term trading.
- We see that the amount of long-term risk traded each month in SONIA can now reach up to £125m in DV01 (April 2018).
- The average amount of long-term risk traded each month in 2018 has been £62.5m in DV01. Remember, this is a single-counted measure, as are all of our volumes.
- This means that longer dated SONIA trading has increased by 3 times compared to the 2017 average monthly amount of just £20m DV01.
Our data unfortunately excludes SONIA-LIBOR basis trading for now. Basis volumes, covering LIBOR vs LIBOR and OIS vs LIBOR, are reported together by CCPs. However, we will keep track of these basis volumes as well, because 3s6s trading should begin to dwindle as SONIA becomes more popular.
Finally, please note that we’ve included a purple trend line that shows the percentage of SONIA risk that is traded in tenors longer than 2 years. It is instructive that there isn’t really a notable trend here. Anything between 5% and 20% of SONIA risk may be traded in longer tenors for any given month.
USD OIS Trading at LCH
With that context in place, let’s look at USD OIS trading in tenors greater than 2 years at LCH:
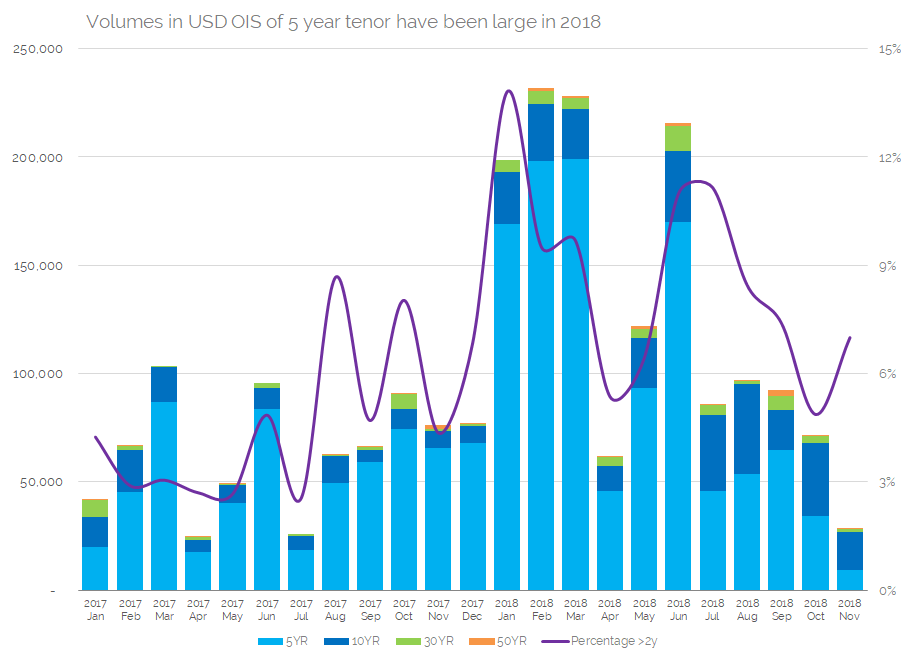
- DV01 of USD OIS cleared at LCH each month for tenors 5y through to 50y. DV01s measured in $1,000s
- Trades in the 5 year bucket really dominate the volumes in USD OIS long-term trading.
- The amount of long-term risk traded each month can reach over $225m (Feb 2018).
- The average amount of long-term risk traded each month in 2018 has been $140m in DV01.
- This means that longer dated USD OIS trading has increased by 2.2 times compared to the 2017 average monthly amount of $65m DV01.
- These volumes include outright SOFR (small) but exclude all basis trades.
It’s interesting to note that long-term USD OIS trading is around twice as large as SONIA ($140m vs £63m on average in 2018).
The purple line again shows the percentage of USD OIS risk that is traded in tenors longer than 2 years. This is generally lower than the SONIA equivalent, but has certainly increased from the 3% level seen in early-mid 2017. At the start of this year, it was well over 12%. That is surprising as short-end Libor-OIS spreads were blowing out, which normally makes the short end of the curve more active than the long end. This is therefore probably a result of excluding basis trades from the data.
Data
We feel that it is very important to track the uptake of RFRs and the transition away from Libor using reliable and thorough data. It is notable that SOFR trading did not occur until CCPs could clear it – which suggests that the uncleared market for OIS trading will remain very small, even in the absence of clearing mandates for new RFRs. Our global view of cleared markets in CCPView therefore provides the most complete coverage possible for RFRs. Contact us today for a trial of the data to see for yourself.
In Summary
- Long dated OIS trading in GBP SONIA and USD OIS is increasing.
- The amount of risk traded in 2018 in long-dated outright OIS is 2-3 times higher than in 2017.
- This could be even higher when including basis trades – something for our users to look at.
- CCPView data allows users to replicate this analysis across CHF, EUR, AUD etc. Well worth doing as trading in RFRs continues.