- We summarise the portion of risk that is traded as OIS across seven major markets.
- Benchmark reforms around the globe are helping transition trading away from Libor into Risk Free Rates.
- We monitor the progression of these reforms by looking at how much risk is trading in OIS products.
How popular are OIS?
Clarus use our data products, incorporating DV01 calculations in SDRView (free trials here), to monitor the proportion of different markets that trade as OIS. This helps us to assess the adoption of Risk Free Rates and to monitor whether the move away from Libor-based products is gathering momentum.
I decided to update the blog this month after a whole host of Libor-related news, including:
- A consultation from ISDA on Libor fallbacks – see my previous blog.
- An FSB statement.
- An FCA speech on LIBOR (“Abandon LIBOR now or else“).
- SOFR futures trading at CME just topped 100,000 contracts.
GBP – Sonia Trading in the United Kingdom
I’ll start with the UK because last time it was the most successful OIS market. Trading could be seen as transitioning away from LIBOR and into SONIA. Has this continued?
All of the charts below show the DV01 traded as LIBOR-based products (and reported to US SDRs) and OIS products. The orange lines are the percentage of risk traded each month as OIS.
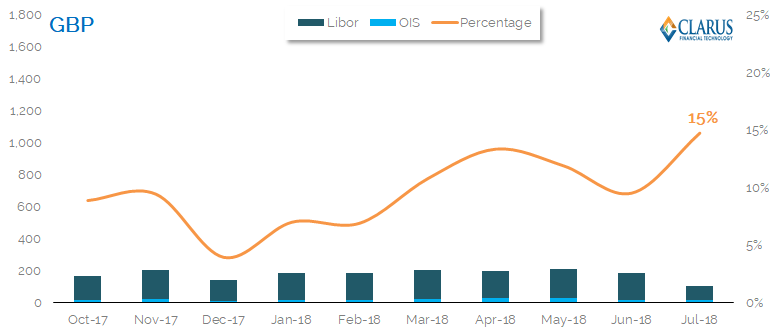
For GBP, the chart shows that;
- There is now 15% of risk traded as OIS. This has increased from 13% when we first wrote about this, although it’s been a bumpy ride upwards.
- GBP continues to lead the way in the proportion of risk traded as OIS in OTC space. When we include futures, this is a different story (see below).
- The BoE took over administration of the SONIA benchmark on April 23rd, so maybe this has incentivized even more people to trade SONIA recently.
- The upward trend of increasing SONIA adoption seems to be continuing – it started in December 2017.
- Benchmark reform is progressing nicely in the UK. Next time we write, we should have more data on the new SONIA futures at CurveGlobal, so we can include these volumes as well.
USD – Fed Funds trading in the US
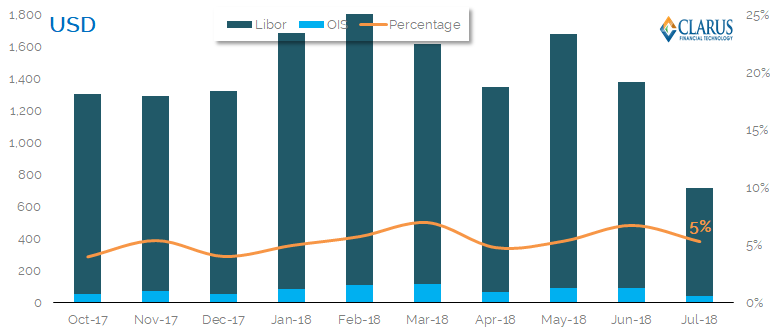
Showing;
- Only 5% of total OTC USD risk is traded as an OIS swap. This excludes basis trading (we look at only outrights) which may explain some of the gap to e.g. GBP markets.
- SOFR swaps have just started to trade in the US. These have mainly traded as basis swaps, therefore would not be picked up on the chart above.
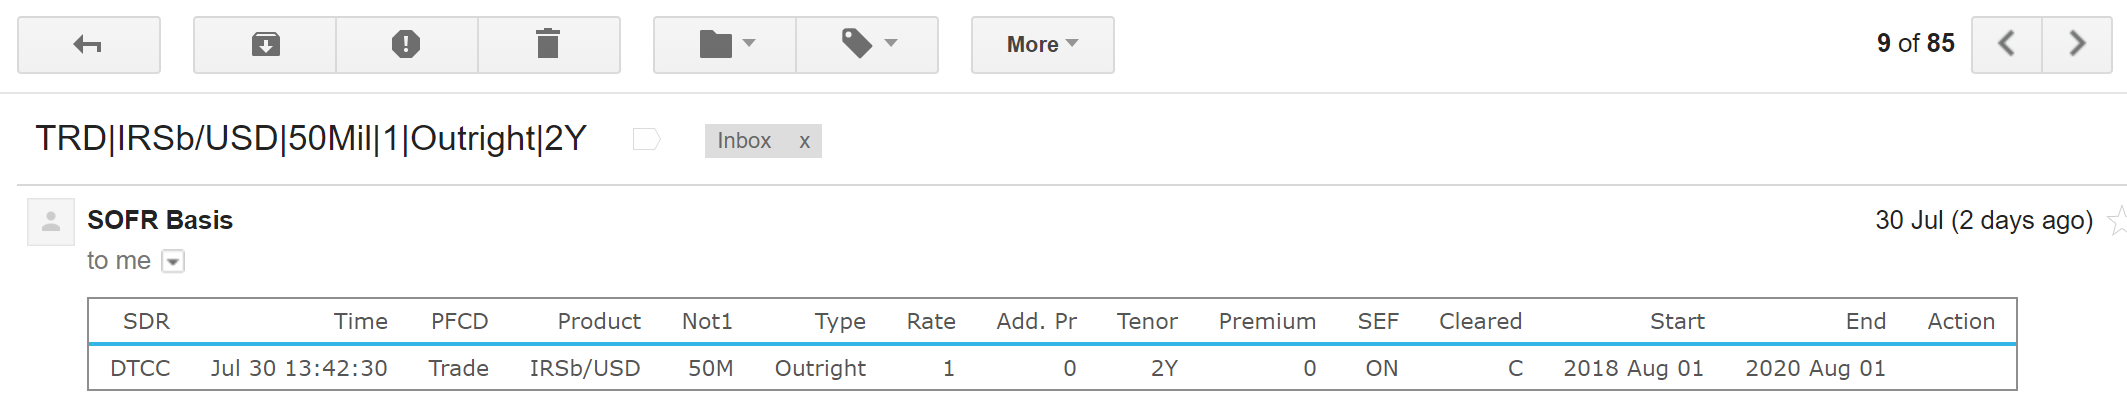
The best way to keep on top of the new SOFR activity is via Clarus SDR alerts. These send the trade details directly to your inbox. For example, yesterday we had the first 2 year SOFR basis trade. Contact us for a free trial:
As noted last time by one of our clients, the chart above excludes Fed Funds futures trading. We have therefore used CCPView to look at OIS trading in the US including Fed Funds futures, and will continue to do so in the future. This also includes CME SOFR futures.
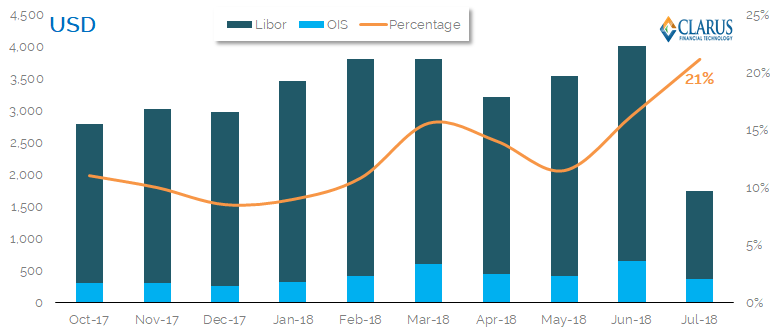
Showing;
- This really shifts the needle. 21% of risk is traded as an OIS product if we include Fed Funds futures.
- There are some caveats to the data – as with any comparison between OTC market turnover and futures.
- It should therefore be noted that we have added in Fed Funds futures, but we have not added Eurodollar (LIBOR) futures.
- Whilst futures turnover tends to be inflated compared to OTC turnover, we should also remember that compression inflates OTC volumes versus futures.
However, it is very reassuring for reform efforts to see the current trend upwards. The amount of risk traded as OIS overall is increasing. Whether 21% is the correct overall number is debatable, but the trend upwards is at least in the right direction.
EUR – Eonia trading in Europe
What about Europe? We are in the middle of a consultation to select an RFR. And yet EONIA trading doesn’t seem very unsettled by its’ imminent demise!
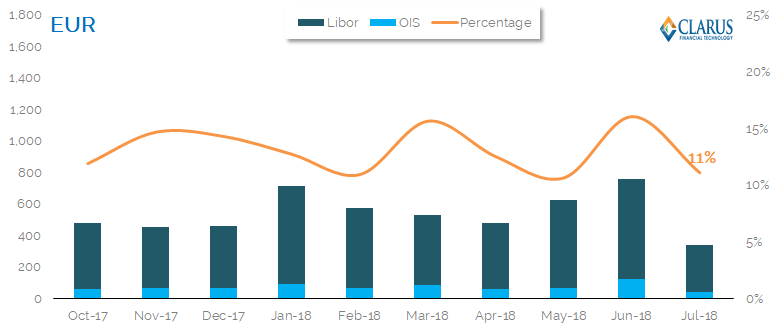
Showing;
- A lot more outright OIS trading takes place in EUR than in USD.
- The proportion of risk traded varies from 11-17% with no trend apparent.
- I guess along with SOFR and (new) SONIA futures, we will also be looking to the likes of ICE, CurveGlobal, CME and Eurex to launch a new futures contract linked to the chosen European RFR. GC futures and Eonia futures already exist at Eurex.
- This chart is somewhat skewed by a reporting bias in the US SDR data, so we will look at this again once we have usable public MIFID II data.
JPY – Tonar trading in Japan
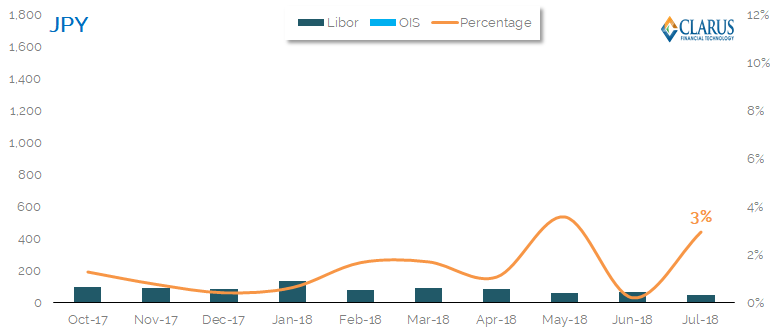
My thoughts;
- There is little evidence that the JSCC’s push into OIS clearing has changed the market yet.
- LCH have an 81% market share in JPY OIS clearing.
- We may only see a small portion of the market in the SDR, but CCPView data confirms that TONAR volumes can be volatile, and little seems to have changed in the past four months.
- Once again, we are left wondering what else can regulators do to encourage more OIS trading in JPY?
AUD – AONIA trading in Australia
For all other currencies, I have changed the scale on the charts so that the OIS volumes show up! Starting with AUD:
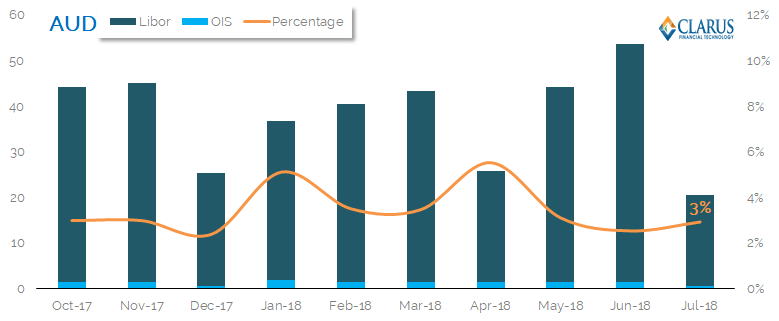
Showing;
- A slight decrease in the amount of OIS (AONIA) risk that is traded as a portion of the whole market.
- We have seen a decrease from 5% to 3% across the market.
- With the RBA already the administrator of this benchmark, more needs to be done by the market to encourage OIS trading.
CAD – CORRA trading
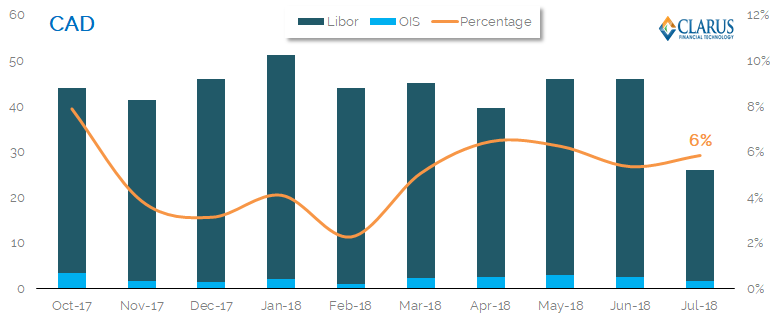
Showing;
- CAD markets in a similar position to when we last reported in April.
- OIS trading has been between 6% and 7% of overall risk for the past few months.
CHF – SARON Trading
And finally;
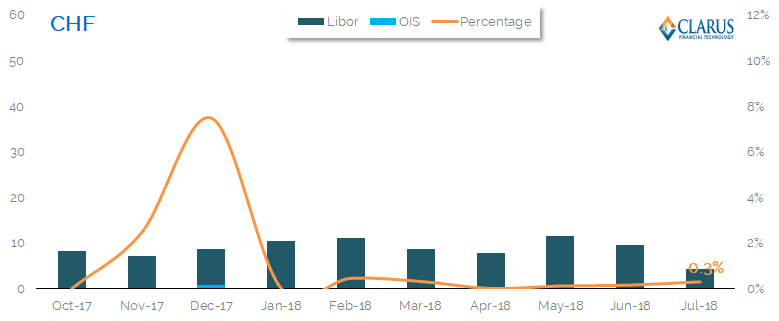
My thoughts;
- A new, robust RFR exists in Switzerland, but trading has flat-lined. The market has only done half a job in the transition so far.
- SARON is already installed as the discounting rate at the CCPs – a move we are waiting to happen for e.g. SOFR (and the new RFR in Europe).
- Our CCPView data shows that volumes in SARON peaked at CHF16bn in April. They have declined markedly since then (~CHF5bn traded in each of May and June).
The Global Picture
We can see that each market is somewhat unique. Our CCPView data allows us to take a step back and look at the global picture too. Unfortunately, we can only do this in terms of notional traded, but it gives us somewhat of an insight into the whole market – not just those trades reported to US SDRs:
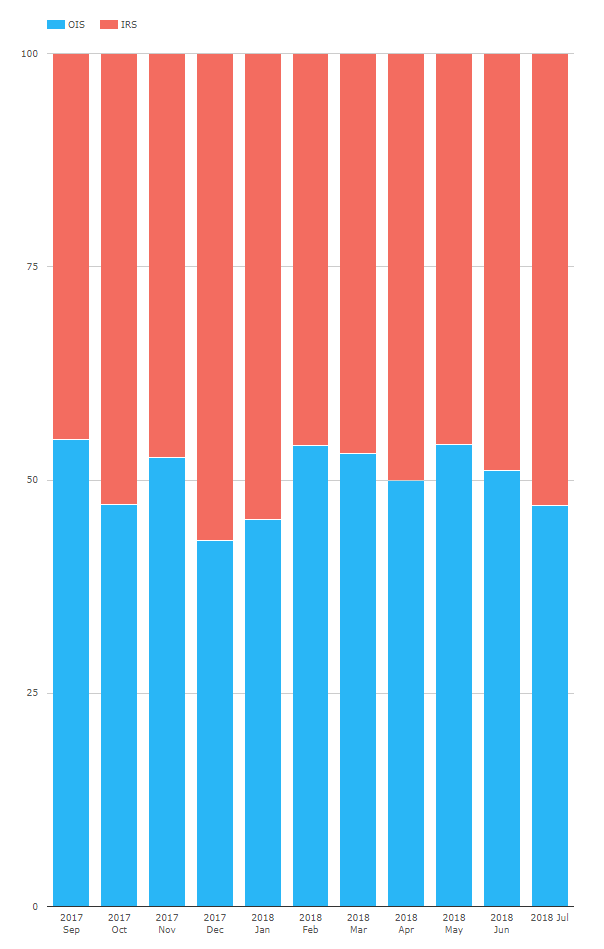
Showing;
- The chart above looks at all IRS and OIS cleared by CCPs across AUD, CAD, CHF, EUR, GBP, JPY and USD markets. It is a much more global data-set than that covered in US SDRs (the source for our previous charts).
- 54% of notional that was cleared was done so as an OIS swap in May 2018. This has declined month on month to rest at 47% in July.
- We do not know the tenor of cleared trades – the CCPs do not report this information. Most OIS trades are short-dated, which represent a small amount of risk but a large notional. This is why this chart looks so different to our DV01 calculations in the previous charts. Remember that DV01 is a maturity agnostic measure of risk, allowing us to accurately compare the amount of risk on a one month swap to a 30 year swap.
- We will continue to monitor this in our data as benchmark reforms take hold.
In Summary
- Up to 21% of the USD market is traded versus OIS across both OTC and Futures.
- SOFR swaps and futures have now started trading in the US; you can monitor their volumes using our SDR Alerts.
- GBP activity in SONIA swaps has continued to increase and now rests at 17% of total volumes.
- Other markets have a lot of catching up to do as benchmark reforms continue.