The end of the year is a traditional time to reminisce. In that spirit, I remember writing my first blog on AUD swap markets from the back of a camper van on the West coast of Oz, after surfing in Yallingup. That experience now feels like a lifetime ago for me personally. Having recently returned from a business trip to the region (how different business travel is to personal travel – both good and bad 🙂 ) I thought I should refresh some analysis on the AUD (and NZD) markets.
As Amir sometimes highlights, with so many blogs behind us, it’s now difficult to remember every blog we’ve written on certain subjects. I was pleased to find that I have a few AUD blogs under my belt already:
- AUD SWAP MARKET
- AUD swap market: Concentration risks from the Clearing Mandate
- AUD Cross Currency Swaps
- AUD Swap Markets in August 2017
Reading through those old blogs, I realise why we quickly stopped making predictions! They serve as a good reminder as to how good markets are at finding their own solutions.
How Big Are The Swap Markets?
From the BIS data (we may as well use it whilst it is “timely”), AUD markets are the 4th most traded currency amongst interest rate derivatives:

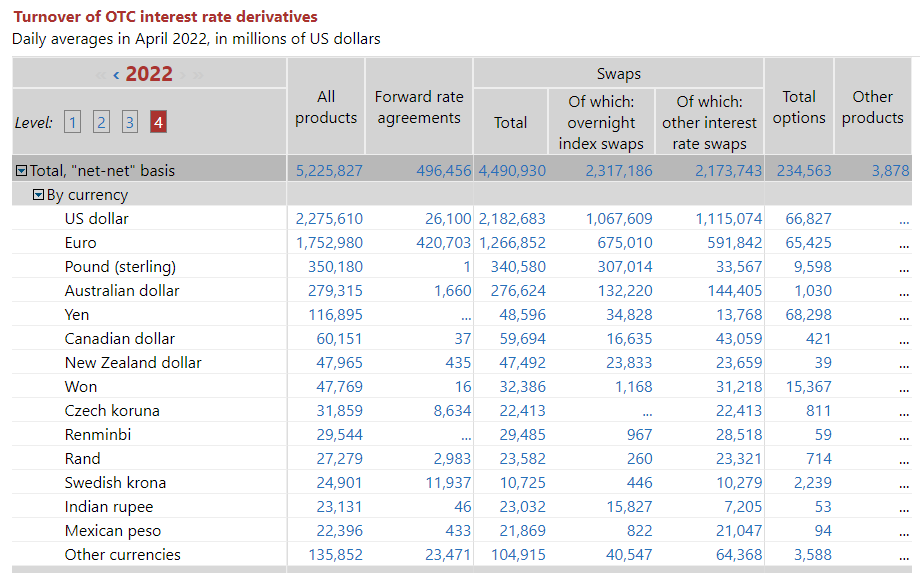
Showing;
- Average Daily Volumes in AUD Interest Rate Derivatives (OTC) were $279bn in April 2022.
- This was split fairly evenly between OIS (vs AONIA) and IRS (vs BBSW).
- It is interesting to see even $1.66bn of AUD FRAs reported in the BIS data. All of the interbank activity is in Single Period Swaps for fixing risk in AUD. Weird.
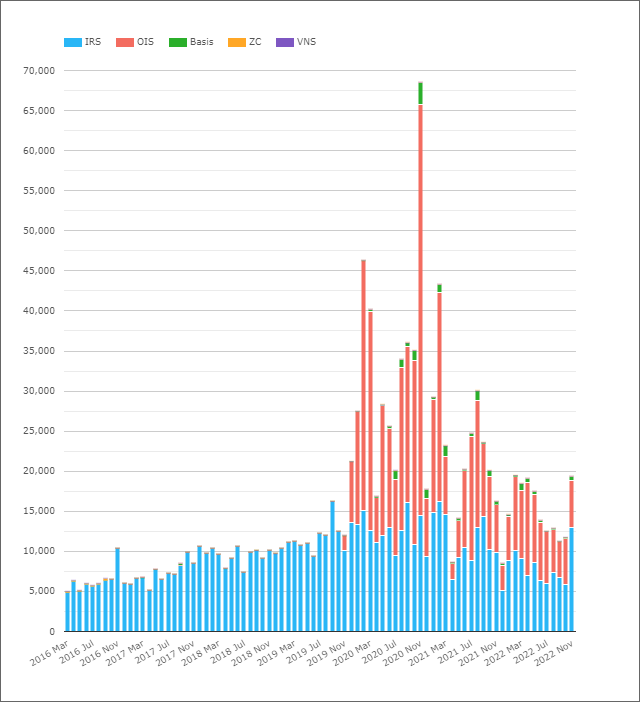
In line with the rest of the IRD market, volumes in AUD have shrunk since 2019:

When we looked at the BIS survey data, we noted that transition to RFRs has resulted in large declines in volumes reported to BIS (mainly as a result of a reduction in FRA volumes). However, AUD markets are neither seeing a sustained move to RFRs (did you know that AUD is one of the six currencies in the ISDA-Clarus RFR Adoption Indicator?) nor trade FRAs!
So what is going on in AUD?
CCPView Data for AUD Swaps
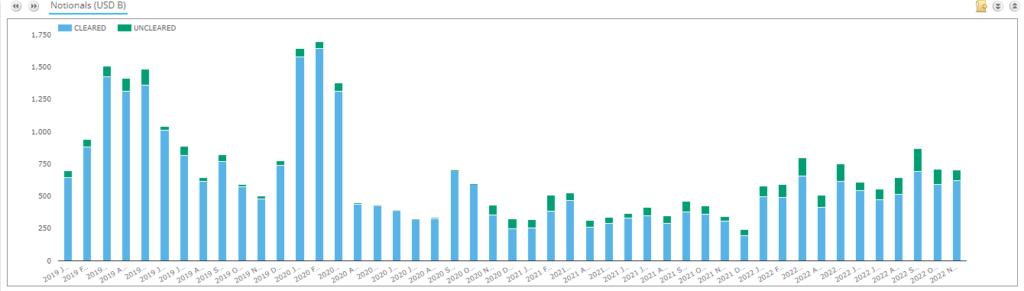
Looking into cleared activity in AUD swaps;

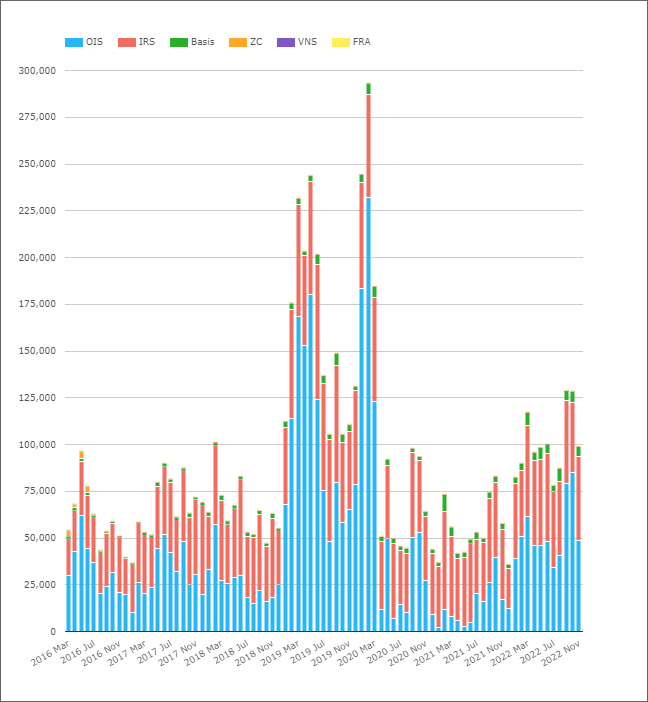
Showing;
- Average Daily Volumes per month in notional terms for AUD cleared Interest Rate Derivatives.
- In April 2022, ADVs in Cleared AUD Derivatives were $96bn.
- This is way below the BIS reported figure of $279bn. Can the difference really be down to non-market facing trades or is there a huge uncleared market out there in AUD? See SDRView Data below for further data points.
- The split by product type shows that OIS typically see higher notional volumes each month than IRS.
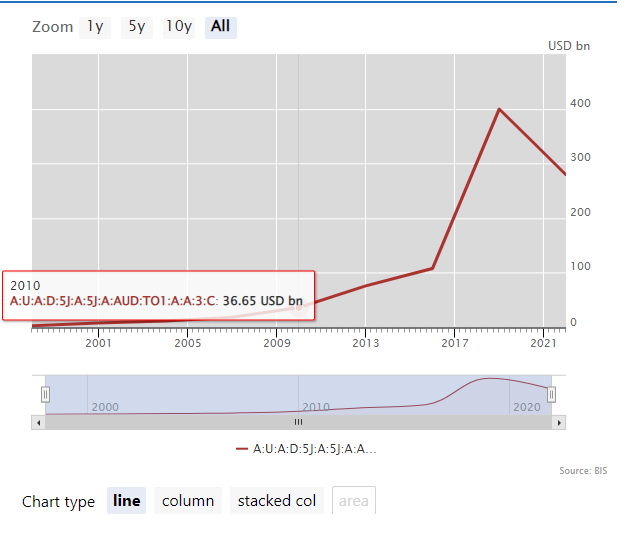
- In terms of the amount of risk traded, our DV01 metrics from the RFR Adoption Indicator show that the proportion of risk traded as an OIS is highly volatile.

- It is interesting to note the sustained move higher in 2022 in the amount of risk being traded as OIS in AUD markets.
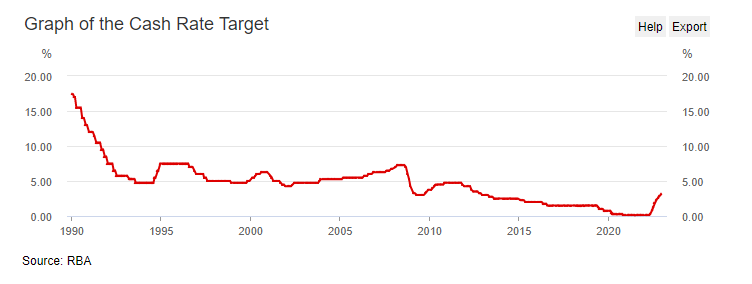
I am struck by how much volumes inflated from February 2019 and stayed there all the way through to the pandemic fueled trading of March 2020. The pattern is repeated in DV01 terms, so it wasn’t just short-end trading. A lot of risk went through the market. Looking at the history of the RBAs Target Rate, they were cutting interest rates even ahead of the Pandemic as the Aussie economy was already headed for recession:

Our CCPView data shows that ADVs were over $125bn equivalent in September and October 2022 – the first time they have climbed above $100bn since March 2020.
This is particularly interesting because the RFR Indicator for AUD shows that more risk was being moved via OIS AONIA than is typical in September 2022. The AUD swaps market has a very bizarre market structure right now:
- AUD OIS trade versus AONIA – nice and simple, like all RFR markets.
- AUD IRS trade versus BBSW 3 month out to 3 years, and then switch to 6 month. Exactly why has been lost in the annals of history, but why we don’t standardise is baffling.
- AUD XCCY markets have chosen to trade AUD BBSW 3m vs USD SOFR. Another strange market structure decision. Every other market with an OIS index (e.g. EURUSD!) has chosen to trade RFR vs RFR. Trading Term vs RFR is a strange financial instrument, mixing forward rate expectations AND credit spreads in one currency versus an overnight rate in another. Weird.
- Much of the liquidity in AUD swaps comes from EFPs – exchange for physicals. These are called “invoice spreads” in any other market – interest rate swaps vs bond futures.
- So an AUD swaps trader has to deal with daily flows in bond futures, OIS, 3m swaps, 6m swaps AND hedge BBSW vs SOFR into something.
- This doesn’t even consider “BOB” swaps – BBSW vs OIS – which have traditionally struggled for traction in long-end trading.
- That is a lot of second-order (and hence potentially idiosyncratic) risk to manage as a swaps trader.
- Trading the whole curve versus AONIA would be a lot simpler.
As I have pointed out for GBP, JPY and CHF markets, the transition to RFRs has substantially reduced volumes. It is interesting to think where AUD markets would be in terms of volumes if everything was just traded versus AONIA! The Basis swap volumes are relatively small, but is all this trading activity really outrights? I am not convinced….!
SDRView Data for AUD Swaps
The previous data suggests there may be a large proportion of the AUD market that is still uncleared. Does this hold true for the portion of the market we see reported to SDRs? Err, no!

Showing;
- Clearing Rates have been as high as 99.4% in some months.
- The Clearing Rate has declined since November 2020.
- For the past two years, Clearing Rates have been more like 85%. This covers Interest Rate Swaps, OIS and Basis Swaps.
- Even with 15% of the market “uncleared” in SDRView data, that is way short of the picture painted from the combination of BIS and Cleared data. It once again leaves us ruing the inclusion of so many non-market facing trades in BIS data.
And the Kiwi Market?
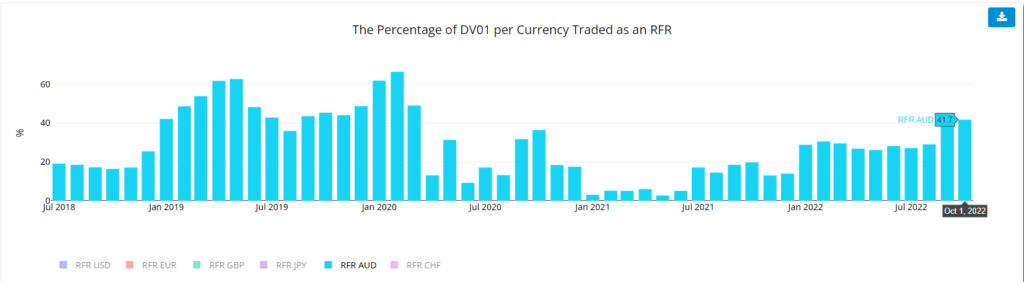
Time is disappointingly short to give the Kiwi market justice here. We are already 1,000 words in, which is pretty much the attention span limit of anyone reading this stuff! Suffice to say that volumes (monthly ADVs are shown in the chart in U$D equivalents) are much larger than I expected, and do appear to be on an upward trend.

OIS adoption in clearing would appear to be the strongest tale to tell for Kiwi markets.
In Summary
- ADVs of cleared AUD interest rate derivatives has fluctuated between ~$80bn and ~$130bn each month in 2022.
- This is substantially smaller than reported by BIS (who reported $279bn ADV for April 2022).
- The “extra” BIS volumes are likely to be non-market facing trades.
- SDRView data suggests that most of the AUD market is cleared, although the uncleared proportion of the market has increased since November 2020.
- We’ll have to look further into NZD markets and the story behind OIS clearing.