
- USD Swaptions activity hit all time records in March 2021.
- Driven by the large sell-off in Fixed Income markets, we see particular evidence in 5Y tails of convexity hedging in Swaptions markets.
- We analyse the activity by strike and underlying (tails).
For once, we are playing catch-up here. Chris Whittall over at IFR brought to my attention that more USD Swaptions were reported to US SDRs during Q1 2021 than ever before. How did we miss this?
By trade count, here are the USD swaptions reported each month since reporting began:

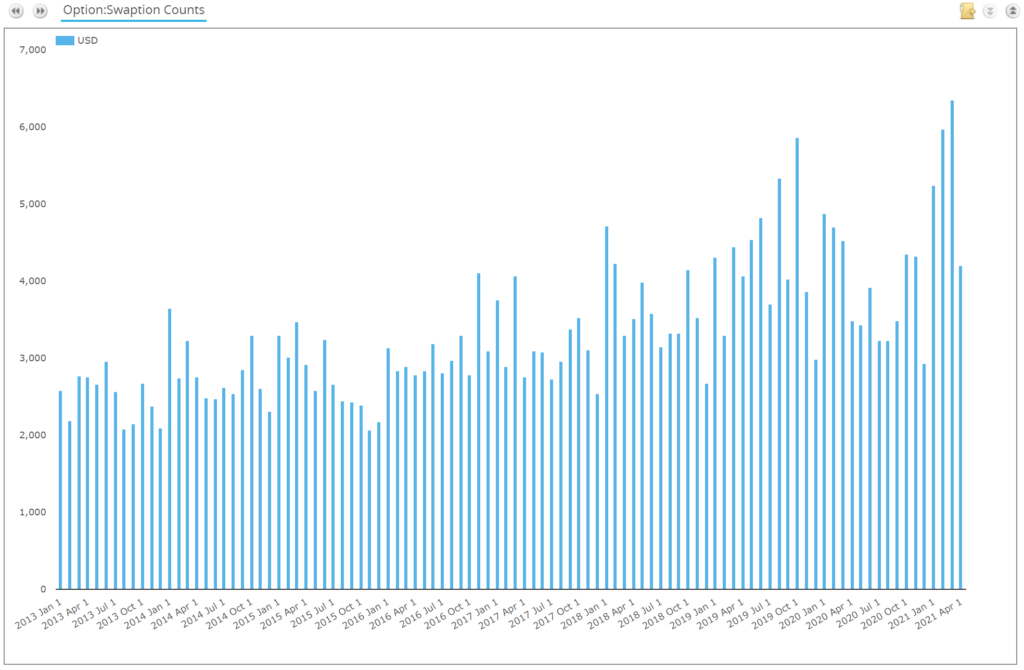
Showing;
- March 2021 was a record month for USD Swaptions activity. 6,346 USD swaptions were reported to US SDRs, more than ever before.
- This was on the back of a record month in February 2021, when 5,973 trades were reported.
- These two months beat the previous record from back in October 2019 which saw 5,861 trades reported. This was also a month that saw a ~30 basis point sell-off in USD Fixed Income, with 10Y swap rates increasing from 1.45 to 1.75%.
- As we noted last year, there was no spike in Swaptions activity associated with the market turmoil in March 2020. That month, only 4,500 trades were reported. Amazing to think that 40% more swaptions traded in March 2021 than March 2020!
- Last month, April 2021, saw activity return back to normal levels, with 4,206 trades reported.
So What Happened in Q1 2021?
Please have a read of the IFR piece entitled “Goldman derivatives traders profit from rates vol explosion” for a bit of flavour.
We will concentrate on what the data shows.
First up, recall that Q1 saw an almighty sell-off in Fixed Income markets. Looking at a chart of 10Y USD IRS from Bloomberg, rates basically DOUBLED from ~90bp to 1.8% in the space of three months:

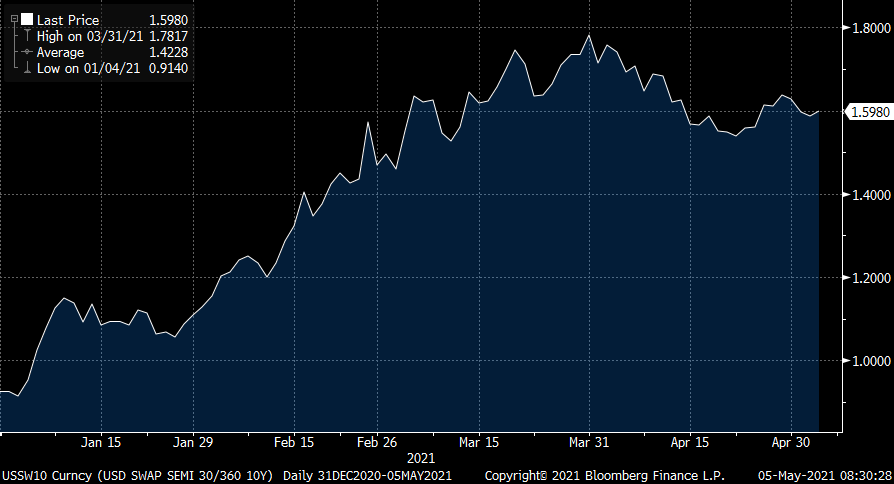
We covered this bond sell-off from a liquidity perspective at the beginning of March 2021, highlighting what was happening in derivatives market liquidity. We also looked at the huge volumes being traded across US Fixed Income across swaps, futures and cash bonds.
What is striking is that during both October 2019 and March 2021, sharp sell-offs in Fixed Income have been accompanied by extraordinarily high volumes in Swaptions markets. We did not see the same effect when Rates fell precipitously during the COVID market volatility last year. Either Swaptions traders couldn’t trade remotely (:-P) or there is a structural facet to the market that causes vol traders pain when interest rates rise.
Convexity
The cause appears to be convexity hedging. The New York Fed reflect here that maybe convexity hedging wasn’t as great in March 2021 as could be expected, whilst Bloomberg was consistently highlighting that negative convexity hedging was indeed to blame! Bloomberg have a great explainer on negative convexity but my simple take is:
- Lots of investors hold Mortgage Backed Securities (MBS) as spreads to US Treasuries.
- To hold MBS versus USTs, you need to estimate the likely maturity of the MBS you hold. This allows you to both sell the right amount of USTs and you choose the appropriate maturity of UST to spread it against (3Y, 5Y, 10Y etc).
- As Rates go higher, US mortgages are less likely to be paid off (refinanced) at lower rates. Therefore, the mortgages underlying your MBS are likely to end up being longer than you expected.
- That means you have to sell your e.g. 5Y UST that you are holding and sell an equivalent notional amount of e.g. 7 years.
- Or you could just sell more of the 5Y.
- Either way, these MBS investors are consistently selling USTs as rates rise.
This need to sell Treasuries when rates rise can instead be managed using Swaptions. Buying Payers at strikes 25,50 or 100bp above the market would make a lot of sense with this convexity dynamic. Of course, when rates then move A LOT, these swaptions will have to be “re-struck” at again higher rates (and also Receivers need to be bought at lower rates too to hedge any correction).
I am still left scratching my head somewhat as to why we didn’t see convexity hedging causing a spike in swaptions activity during March 2020. Anyone knowing the answer, please comment below.
Anyway, onto the data….
Swaptions Activity by Strike
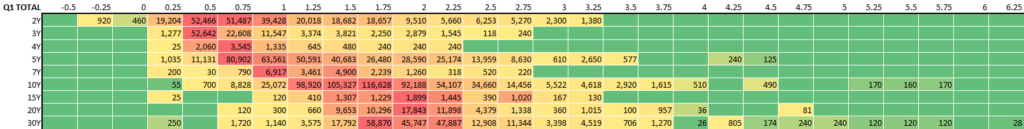
Here is a summary of Q1 2021 USD Swaptions activity:

Showing;
- The notional volume (in $ millions) of USD swaptions traded in major tenors in 25 basis point strike increments.
- This covers all expiries. A 3m10y is grouped together with a 1y10y if they were traded at the same strike.
- This covers Payers, Receivers, Straddles and Exotics.
- It looks at new volumes traded in the quarter. This is not the same as Open Interest (such as the CME Heat Maps) but it nevertheless gives an idea of activity.
- Red areas show the “hottest” strikes and tenors, those with the most notional volume traded.
- Starting at the “cold” ends, we did see some negative strikes trading in Q1. Obviously, those aren’t the focus for this particular blog!
- We saw strikes all the way up to 6.25% trade in the quarter (for 30Y underlyings), however activity quickly drops off at 5% strikes and higher.
- The highest strike with more than $1bn traded in a particular tenor was 3.75%, which saw $1bn or more traded versus 10Y, 20Y and 30Y underlyings (the underlyings are also referred to as “tails” FYI).
- The red areas largely reflect where the at-the-money rates were as vol trading is naturally concentrated around these areas.
- Unlike swap markets, notional amounts are not particularly inflated at the short-end in swaptions markets.
- The most active tenor was 10Y, with $567bn traded across all strikes in Q1 2021.
- There is then quite a gap to activity in 5Y underlyings, with $354bn traded.
- 30Y tenors across all strikes saw $213bn notional traded, almost the same as 2Y tenors with $252bn.
Month by Month 2021 Activity
If we replicate the same chart but look at only the activity in January 2021, it is notable how much further “left” the activity was:

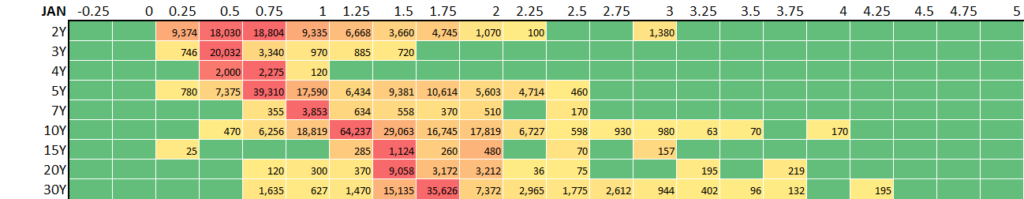
- The At The Money activity jumps out thanks to the colour scheme. $64bn 10Y at 1.25% versus $39bn 5Y at 0.75% and $35bn at 1.75% in 30Y.
- There was still around $1bn of activity in strikes as high as 3% in 2Y, 10Y and 30Y swaps.
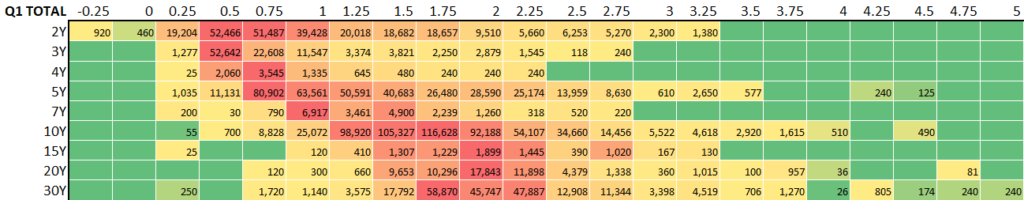
Let’s now compare this to the March 2021 heatmap:
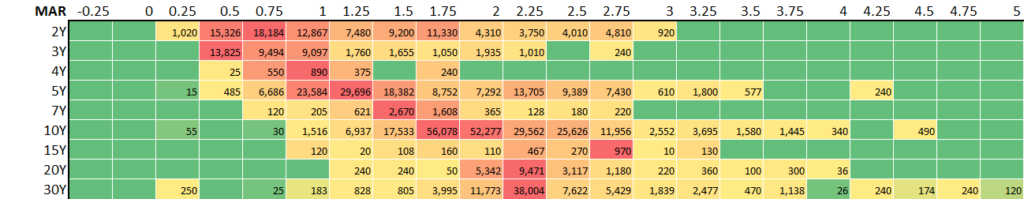
Showing;
- The red-hot areas have shifted right for 5Y underlyings and longer. This reflects the sell-off we saw in the Fixed Income markets.
- Notional amounts were about 25-30% higher across the board in March 2021 versus January 2021.
- 30Y underlyings had activity concentrated at 2.25% strikes in March, but saw very similar overall activity ($76bn in March versus $71bn in January). However, the spread of activity was much larger.
- $5.2bn notional of 30Y underlyings traded at strikes higher than 3% in March 2021, compared to just $0.8bn in January.
- Across all tenors, $16.7bn of notional traded at strikes higher than 3% in March 2021, compared to just $1.6bn in January.
Swaptions Activity by Tenor
Finally, we can look at the evolution of the activity for each underlying. For example, starting with 10Y:


Showing;
- The distinct evolution of 10Y activity toward ever higher strikes.
- Activity in January was hugely concentrated in strikes between 1-1.25%. In March, activity stretched all the way across a 1.5-2.5% range!
- And in March there is a large spike in activity at the higher strikes with nearly $8bn traded above 3% versus just $0.3bn in January.
And in 30Y:


- The concentration of activity is much more consistent here between January and March. 75%-80% of activity was within +/- 25 bp of the ATM strikes in both months.
- We do again see the big spike in activity in strikes higher than 3%. $5.25bn traded in March versus $0.9bn in January.
Finally, 5Y:


- The distinct “move right” is well in evidence.
- Even the short-end of the curve wasn’t exempt from the sell-off.
- Much like 10Y, March 2021 saw a very wide spread of activity in 5Y underlyings.
- Check out the activity in strikes ranging from 2.25-2.75% strikes! Over $30bn traded versus these deeply out the money strikes. Admittedly, this might be activity in very long expiries (I’ve not looked yet).
- Notably, more 5Y notional traded at 2.5% than 30Y. This is unusual as 2.5% is a full 125 basis points away from the 5Y at the money but just 25 basis points away from the 30Y!
I don’t think it is a huge leap to suggest this elevated activity at strikes +100bp away from the ATM in 5Y are directly related to convexity hedging activity. Nice to see it coming through in the data!
Swaptions Activity by Payers, Receivers, Straddles
It would be interesting to replicate the analysis by the directionality of the underlyings (tails). Please comment below if you would like to see that, or subscribe here to perform the analysis yourselves.
In Summary
- Uncleared swaptions remain a huge market, with over 6,300 trades in busy months.
- We did not see a spike in Swaptions activity during the March 2020 market turmoil, which may have suggested swaption markets were not in a great place.
- However, activity surged in Q1 2021 to record numbers in both February and March 2021.
- Swaption heat maps help highlight convexity hedging.
- Public SDR data allows us to analyse activity by strike and tenor, bringing much needed transparency to this huge uncleared market.
- Comment below to see more Swaptions coverage on the Clarus blog.