Disclosure: This blog was written on the BA723 GVA-LHR flight. Well done to BA for making WiFi finally available on European short-haul flights. It is a little more brief than usual, but hurrah to be travelling again.
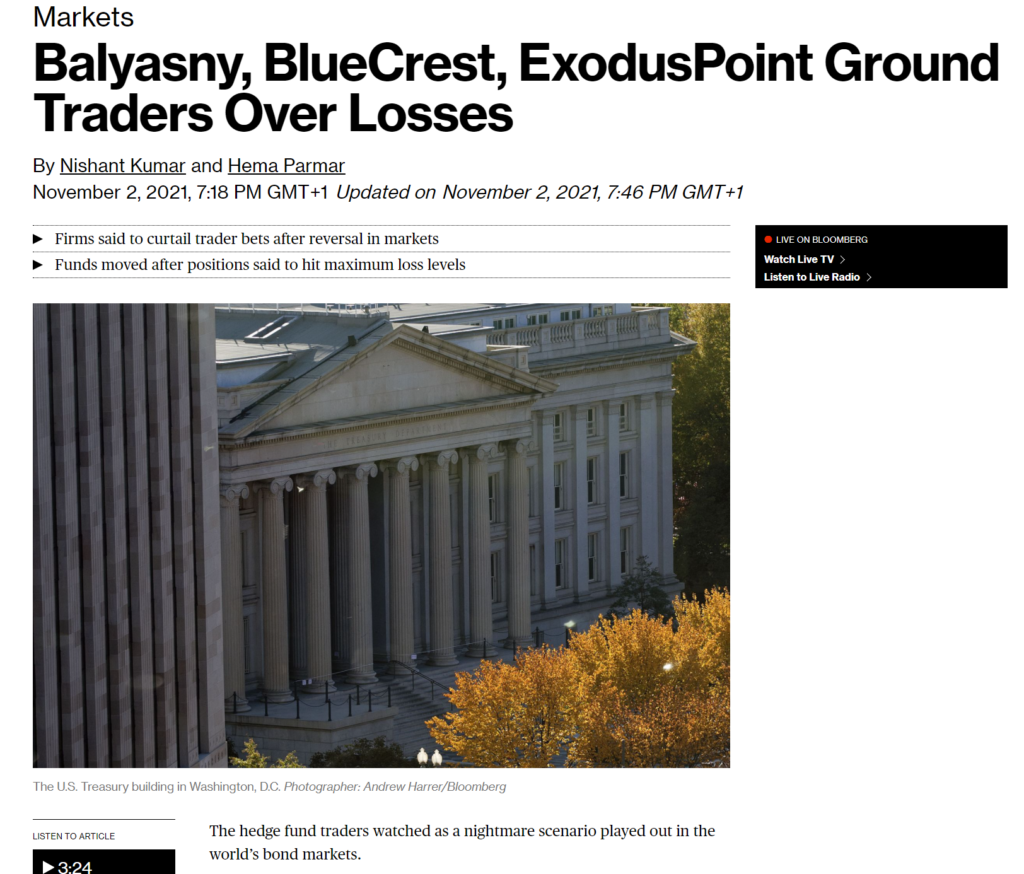
With the Fed “in-session” right now, there has been a decent move higher in short-end USD rates over the past month. As ever with moves of this magnitude, we have the press writing stories about “blood on the Street”:
We don’t really go for anecdotal evidence here on the Clarus blog, so we thought it would be worthwhile to lay-out what has happened and whether we see any evidence for abnormally large trading activity in the data.
USD Data
First off, to put the volumes over the past month in context:
- October 2021 was the largest trading month by notional since the pandemic-induced mayhem of Q1 2020.
- However, in terms of risk traded (DV01), October 2021 was nothing particularly special.
- This likely highlights the nature of re-positioning that has occurred – it has been a short-end shock to the curve in terms of repricing expectations of where Rates are headed in the sub 5Y area of the curve.
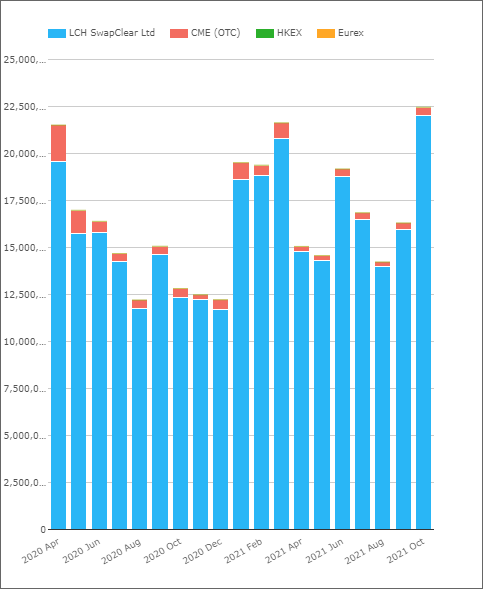
Our first chart today shows;
- Notional amounts of cleared USD Swaps since Q1 last year. $22.5Trn in October 2021 hits a recent record for notional amounts cleared.
- The chart covers global volumes across both USD SOFR and USD LIBOR (plus Fed Funds, basis, inflation etc) cleared at CCPs.
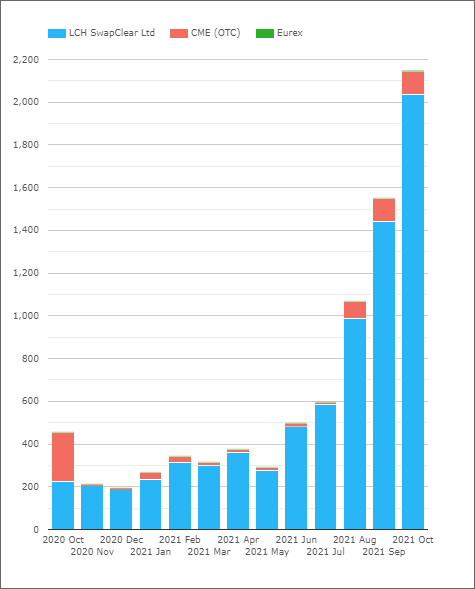
Drilling-down a little into this chart we can identify that it was another record month for SOFR trading. Importantly, that means it was the largest month ever in terms of SOFR DV01 transacted. We’ll cover this in greater depth when we publish the updated ISDA-Clarus RFR Adoption Indicator later this week:
USD Rates Moves
What happened in terms of prices? Looking at USD SOFR swap rates from Bloomberg, we can see the difference in the magnitude of the move higher in rates across the curve:
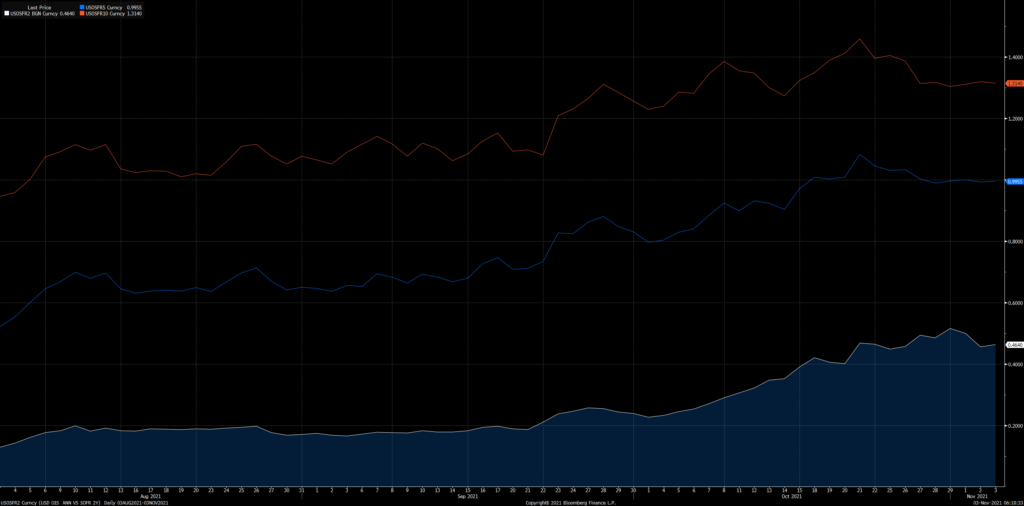
Showing;
- 2Y USD SOFR swaps moved higher from 24 basis points all the way up to 52 basis points at the end of the month.
- 5Y also moved higher, from below 83 basis points (0.83%) to over 1.08% at one point.
- 10Y moved from 1.25% to as high as 1.45% before moving back lower to 1.31%.
With 5 year swaps moving around, it makes the 2s5s10s butterfly VERY interesting. For those who like such things, the long-term chart of where 2s5s10s is since SOFR started trading is quite the talking point:
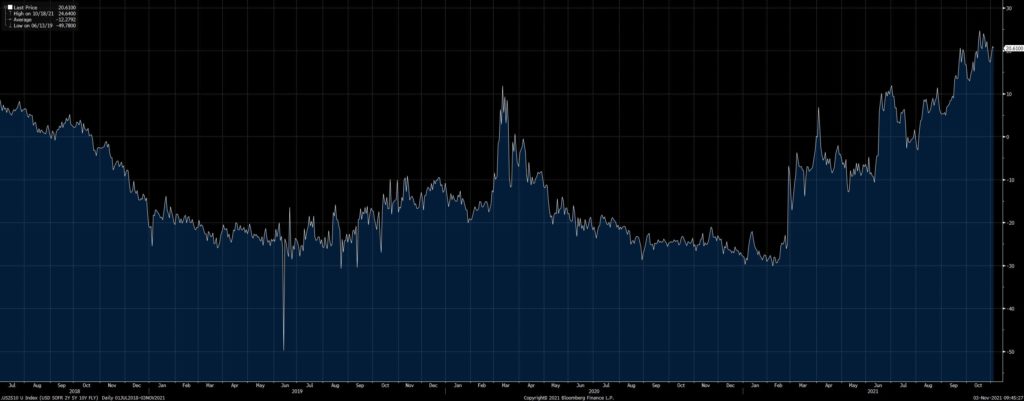
This fly hit all time highs at 25 basis points last month. That is pretty brutal. It is not that unusual for this fly to move around – but for those betting on “mean reversion” type of activity it is likely painful. These moves just highlight how sensitive the shape of the curve is, and with rates so low, these flies can move nearly as much as outrights these days.
USD Swaptions Activity
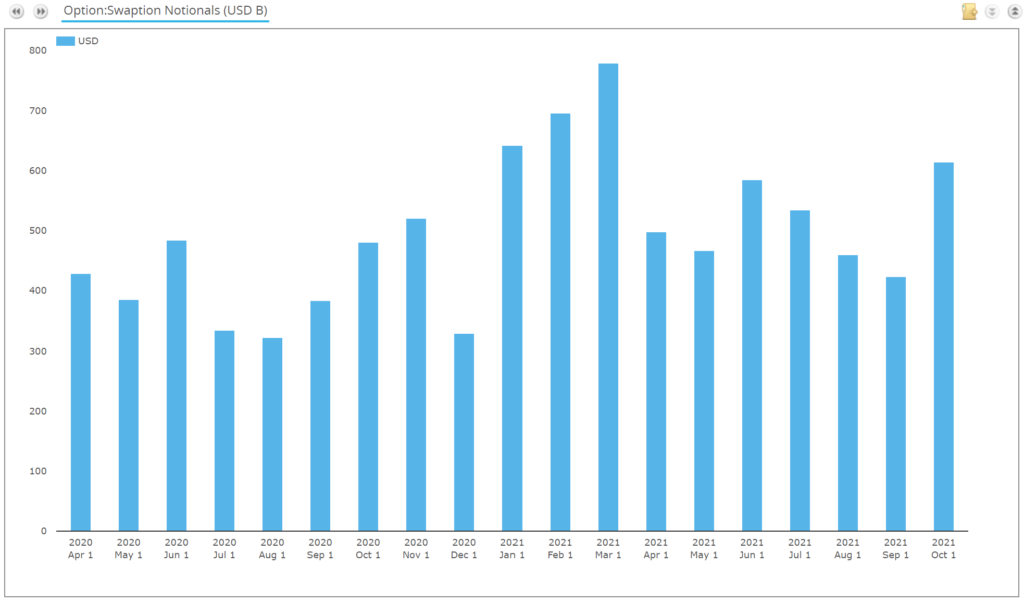
Swaptions activity was not elevated last month. This is surprising given the large moves in outright rates that we saw. In notional terms, it was a more active month than Q2 and Q3 this year, but Q1 2021 was more active for Swaptions:
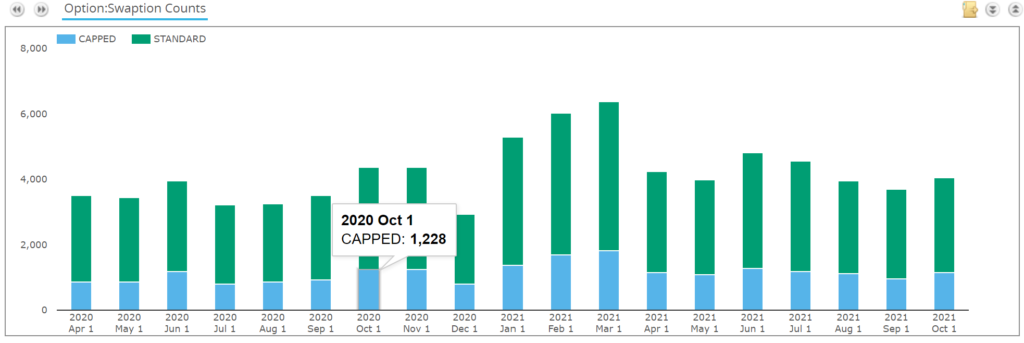
On a trade count basis, October 2021 looks even less impressive, with nothing really noteworthy in terms of number of trades or the number of block trades transacted:
Looking at the heatmap of option strikes traded:
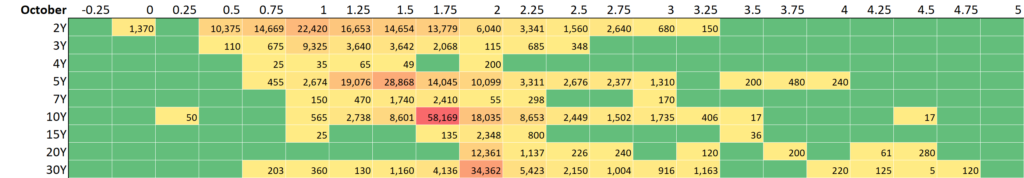
Showing;
- The notional volume (in $ millions) of USD swaptions traded in major tenors in 25 basis point strike increments.
- This covers all expiries. A 3m10y is grouped together with a 1y10y if they were traded at the same strike.
- This covers Payers, Receivers, Straddles and Exotics.
- It looks at new volumes traded in the month. This is not the same as Open Interest (such as the CME Heat Maps) but it nevertheless gives an idea of activity.
- Red areas show the “hottest” strikes and tenors, those with the most notional volume traded.
- The red areas largely reflect where the at-the-money rates were as vol trading is naturally concentrated around these areas.
- The most active tails were 2Y, with $108bn traded across all strikes in October 2021.
- 10Y underlyings also saw over $100bn traded.
- 5Y and 30Y tails saw $86bn and $52bn traded respectively.
It is a bit of a worry for Swaption markets that activity did not scale-up as much as we would expect. Why is this? It is very difficult to say.
Q1 2021 was extremely active this year (with convexity hedging as the likely driver), suggesting there is bandwidth for the Swaptions market to scale-up when demand is there. But we also noted that Swaptions activity failed to scale during the Q1 2020 mayhem.
Ahead of the recently announced SOFR First initiative for USD Swaptions (coming next week!) it will be interesting to observe how this market evolves with new products trading.