- USD Rates volumes have returned to the levels we saw in March 2020.
- We look at whether these volumes are being driven by US Treasuries, bond futures or OTC swaps.
- Clarus provides volume data by tenor for all of these asset classes under a single data subscription.
CCPView provides granular data on traded volumes across Futures, Swaps and US Treasuries. With the recent sell-off in Fixed Income markets, I was interested to see what had happened to volumes across the whole of the Rates complex.
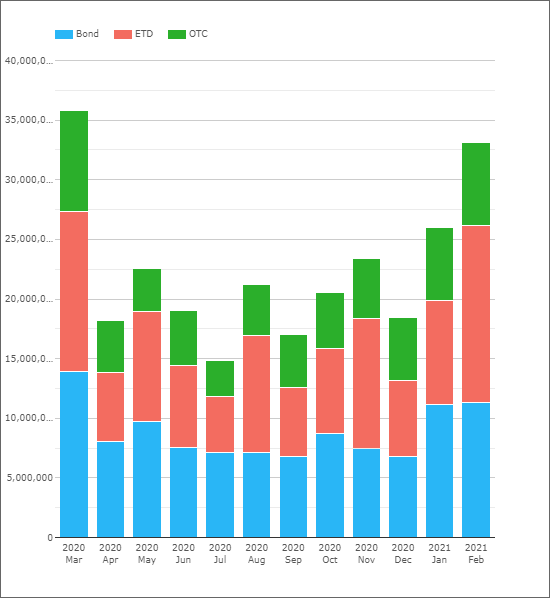
USD Outright Volumes
The chart below shows monthly volumes since March 2020:
Showing;
- Monthly volumes in notional equivalents across all long-dated USD rates products.
- The chart looks at all products with tenors longer than 2Y – covering Bonds (US Treasuries), ETD (bond futures) and OTC (interest rate swaps and OIS).
- March 2020, when post-trade transparency data was first made available for US Treasuries, was obviously an unusual month with $35Trn+ traded across all products. This was largely driven by the pandemic-fueled volatility.
- However, it is notable that Q1 2021 has also been marked by elevated levels of trading. This is likely driven by the large sell-off in USD rates that we have seen.
- February 2021 recorded $33Trn in notional-equivalent traded, the largest volume month since last March. This was on the back of $26Trn traded during January, which was again the highest month since last March.
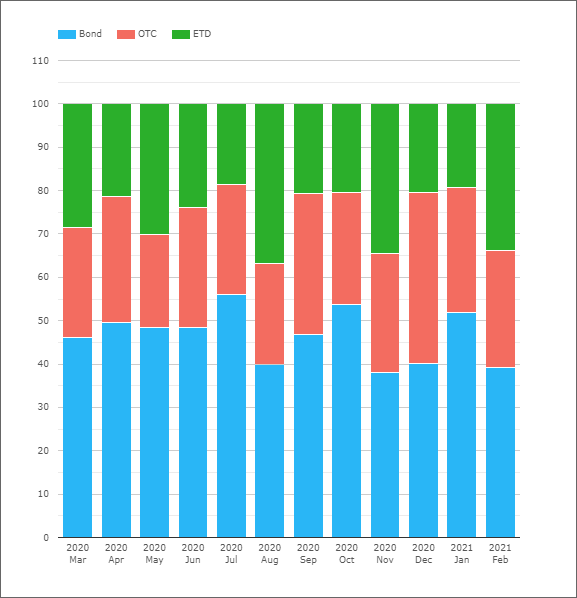
Product Split in USD Rates
The chart below shows the same data as above, but as a percentage of volumes traded:
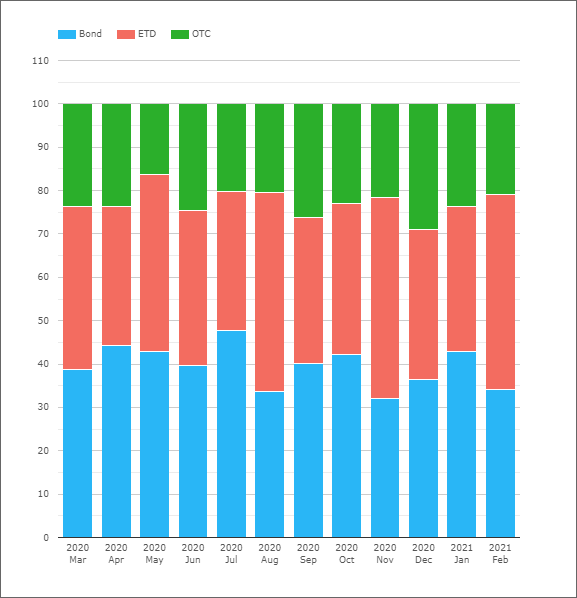
Showing;
- On average, 40% of notional is traded in cash bonds. This ranges from 32-48% month on month.
- 38% of notional equivalent is traded in ETDs (bond futures). This ranges from 32-46% month by month.
- 23% is traded as OTC (interest rate swaps). This ranges from 16% to 29%.
- There is no particular pattern that suggests the recent sell-off has been focused in a single asset class. During January, US Treasuries were the largest market.
- The effect of the roll in bond futures can be seen in the data for August, November and February, where the futures contracts are typically rolled prior to the last day of the month. This inflates volumes in bond futures and results in ETDs consistently recording a 45% share of total volumes in these months. It would be nice to smooth this effect out in our data.
- Absent these rolls, US Treasuries are always the largest single market. Useful for considering where the most “liquidity” lies if you have a large chunk of risk to move.
10 Years
We can run the same analysis by any tenor we choose. I found it interesting to look at just the 10Y tenor first:
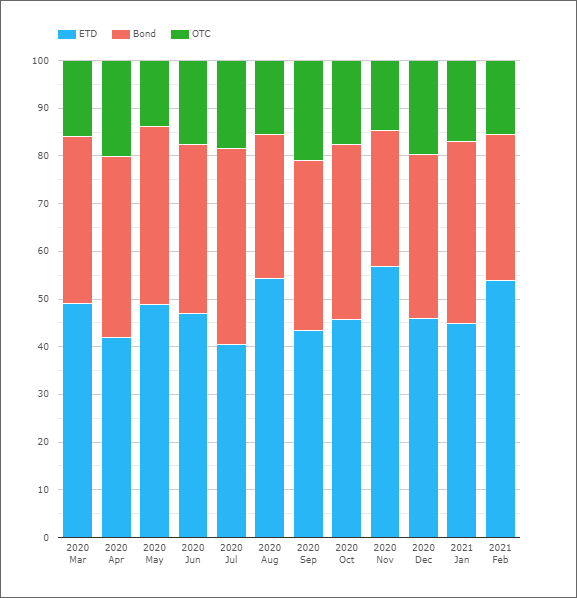
Showing;
- Bond futures now jump to the largest asset class, with 48% of notional traded.
- US Treasuries are the second largest at 35%.
- OTC remains the smallest market – I find this surprising.
Let’s see if OTC triumphs in the longer end?
30 Years and Longer
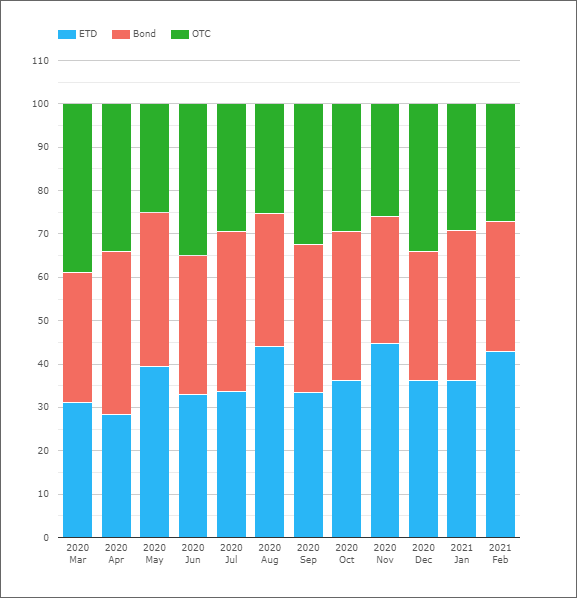
This is a pretty interesting chart!
- OTC derivatives were the largest notional traded during March 2020, recording 39% of total US Rates volumes.
- This performance has only been repeated once, in June 2020.
- In fact, OTC derivatives have dropped down to the least traded asset class in 2021, recording just 28% of total volumes.
- Either way, in this long end of the curve (effectively capturing any product with a tenor longer than 10Y), the choice of asset class traded is very finely balanced.
- The one year average split has been 32/37/30 Bonds/ETD/OTC.
5 Years
- US Treasury volumes dominate the short-end of the curve.
- USTs account for 46% of volumes on average.
- ETD and OTC are pretty evenly balanced with 25-27% each.
ETD and OTC in particular compete against Eurodollar futures for trading activity in this part of the curve (although not as much as in the 2Y and shorter tenors). Our ETD figures for this chart only look at bond futures.
In Summary
- USD Rates volumes have returned to the levels we saw in March 2020.
- Over $33Trn traded in February 2021.
- The overall split of volumes between US Treasuries, Bond Futures and OTC swaps is consistent month to month.
- The split between these three asset classes varies between short and long-dated tenors.
- Our data shows that 10Y is dominated by bond futures, whilst the shorter end of the curve is dominated by US Treasuries.