- Eurex EUR share stands at 7-9% when measured by DV01.
- Globally, August 2021 saw the lowest EUR IRS volumes in the past 5 years.
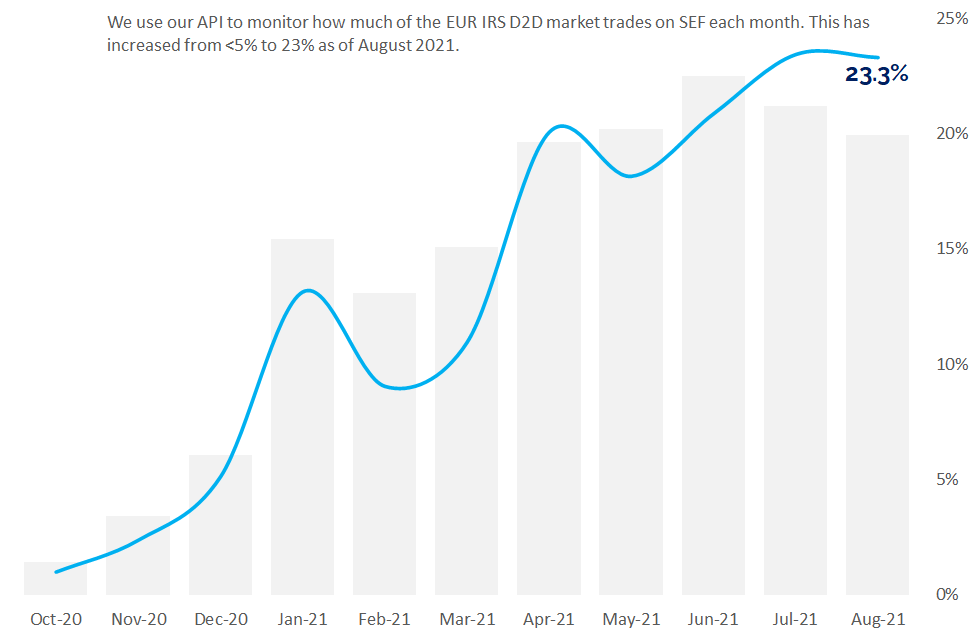
- 23% of EUR IRS executes on-SEF.
- 60% of EUR CRD Index volumes now execute on-SEF.
- And we look at where clearing of EUR CRD Index trades is taking place.
Now that the Summer lull is well and truly over it is time to update the data behind our dominant themes on the blog so far this year. We looked at SOFR and RFRs last week. We revisit the Brexit themes this week – what is happening in EUR Clearing and what is happening with EUR trading on SEFs?
EUR IRS Market Share
First up, let’s cast our eyes over the data for Clearing of EUR products. The main “battleground” is of course EUR IRS which is split between LCH SwapClear and Eurex clearing.
There are many ways to look at the market share statistics, and we will present most of them below. It is worth noting that August was a really slow month for EUR swap trading, recording the lowest volume of at least the past three years. That doesn’t paint a great picture of a healthy underlying market, but that could all change as we head into September’s issuance season.
I ran this query back to the beginning of our dataset, and I think August 2021 saw the lowest EUR IRS volumes since June 2016 – over 5 years ago!
EUR Rates Market Share – All Products, Gross Notional
With that stated, let’s look at some market share stats for CCPs. First, across all EUR rates products (IRS, OIS, FRAs, Basis, Inflation…):
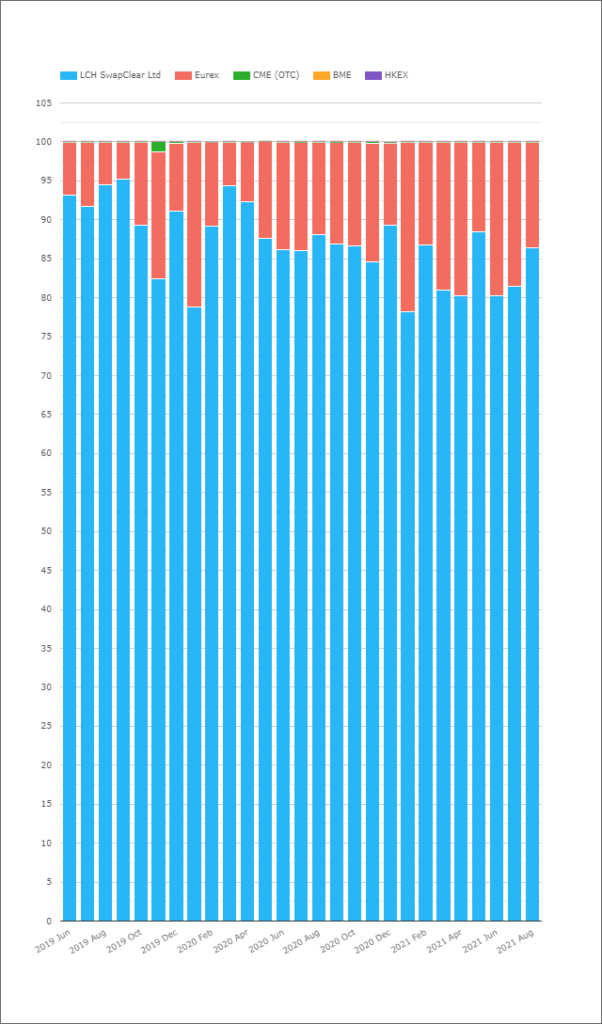
- Eurex recorded 13.5% market share in August. That is in line with their 10-20% market share for the past 12 months.
- It is a pretty variable measure month-on-month.
Typically, we only look at the market share excluding EUR FRAs. This is because they are large notional, short-dated instruments used mainly for portfolio maintenance. They hedge so-called “second-order risks” in a dealers portfolio and can distort the view of real risk being traded.
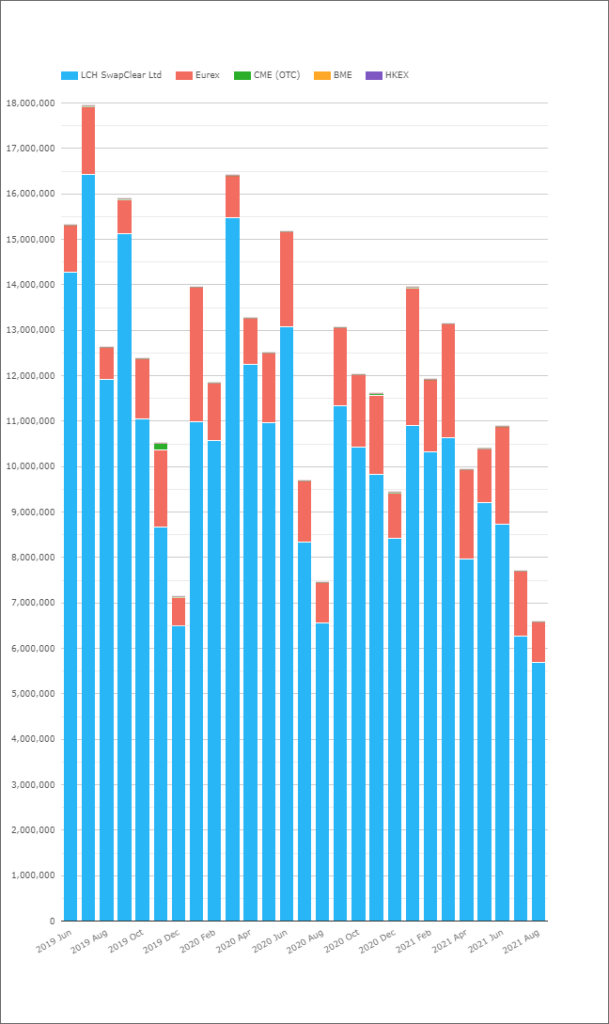
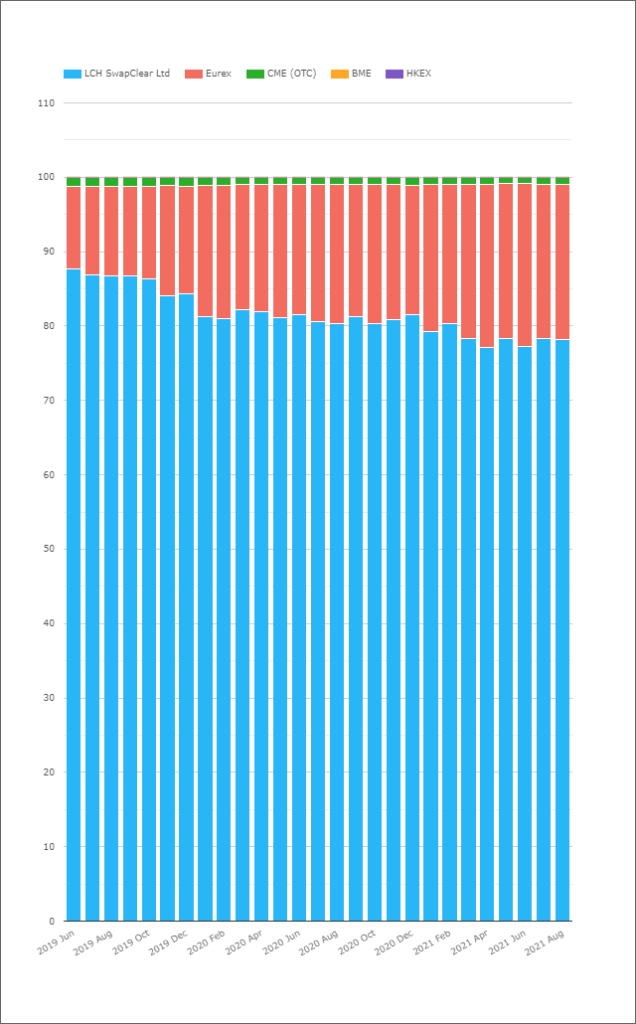
EUR IRS Market Share – Gross Notional
If we exclude FRAs it can also make sense to exclude all short-dated products. Let’s just have a look at EUR IRS then (Fixed Float, longer-term interest rate swaps):
- The market share of Eurex is in the 5-9% range during 2021.
- This is quite different to the first chart we showed.
Fortunately, we can combine the two data sets if we use a maturity agnostic measure of risk. Step-forward our next data set.
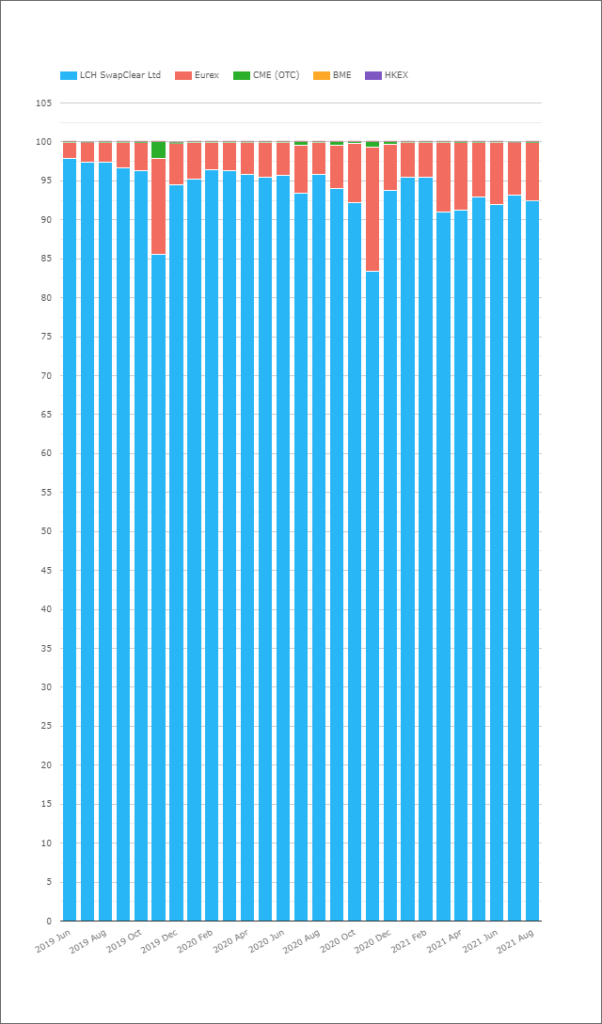
EUR Rates Market Share – All Products, DV01
We use DV01 in most of our metrics at Clarus, including in the construction of the ISDA Clarus RFR Adoption Indicator. It avoids distortions such as the above. We can therefore look at Eurex market share using DV01 directly in CCPView:
I find it reassuring to have the right tools at my disposal to be able to answer important questions accurately:
- DV01 removes any distortions from large notional, short-dated trades.
- We can look at a fair measure of market share in terms of risk traded across all EUR rates products.
- It is a single, simple query.
- We find that Eurex have a market share of about 7-9% in EUR Rates products. LCH SwapClear has the remaining 91-93% of the market.
- These market share metrics have been pretty stable for the past 8 months.
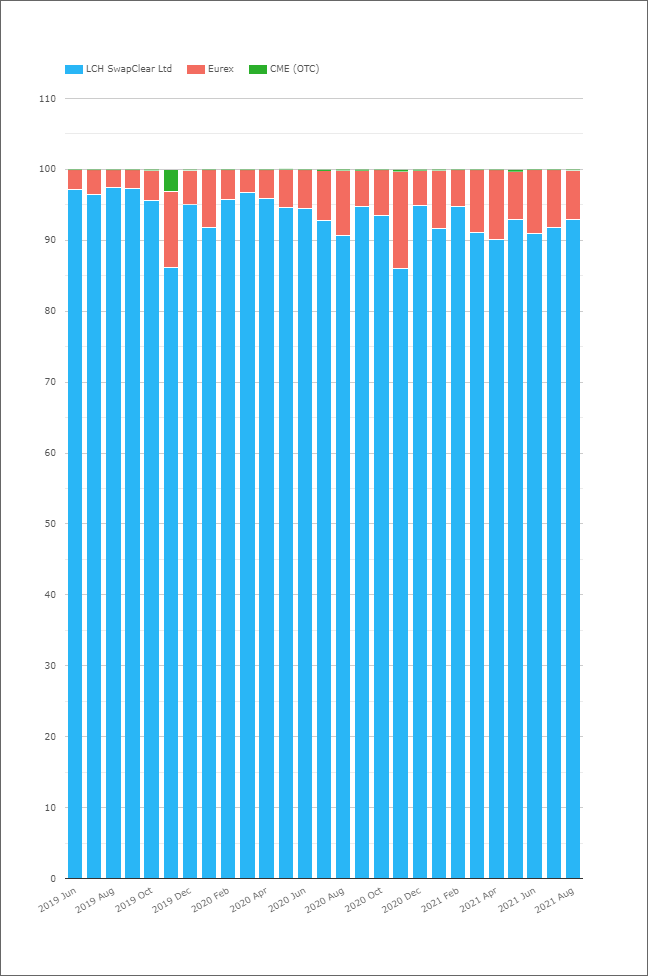
EUR Rates Market Share – Notional Outstanding/Open Interest
It is also worth considering the market share in EUR Rates markets not just from a new risk traded perspective, but also using notional outstanding metrics. It paints a different picture. Remember that this is in gross notional terms, not in DV01:
This chart shows that over 20% of the outstanding notional of EUR rates products lies at Eurex. 78% lives at LCH SwapClear and the balance at CME.
Why is this so different to the gross new risk traded in notional terms? I can think of a potential number of reasons:
- Compression may be more efficient for CCPs with a larger market share. This is because the more flow that goes through a single CCP, the more likely there are offsetting positions to compress.
- If dealer-to-dealer flow is concentrated at a single CCP, there are likely to be more offsetting positions because dealers are expected to have two-way flows across their franchises.
- Equally, if a CCP has mainly client flow, this is expected to be directional. This means that there are no off-setting positions and hence Outstanding Notional increases.
As we know from our blogs on GSIB metrics, dealer banks are still very focused on gross notional. Compression continues to be a big focus in the industry, and it is important that Rates can be traded as efficiently as possible. It is something to keep an eye on as time progresses. And as Open Interest increases at a CCP it also raises questions as to where the CCP Basis should lie. Something that was well covered in Risk.net this month:
EUR CDS Clearing Market Share
Elsewhere in the Clearing space, it is worthwhile noting that there has been no move toward European clearing of CDS trades. The only trend here seems to be an increasing market share for ICE Clear Credit, who are New York based:
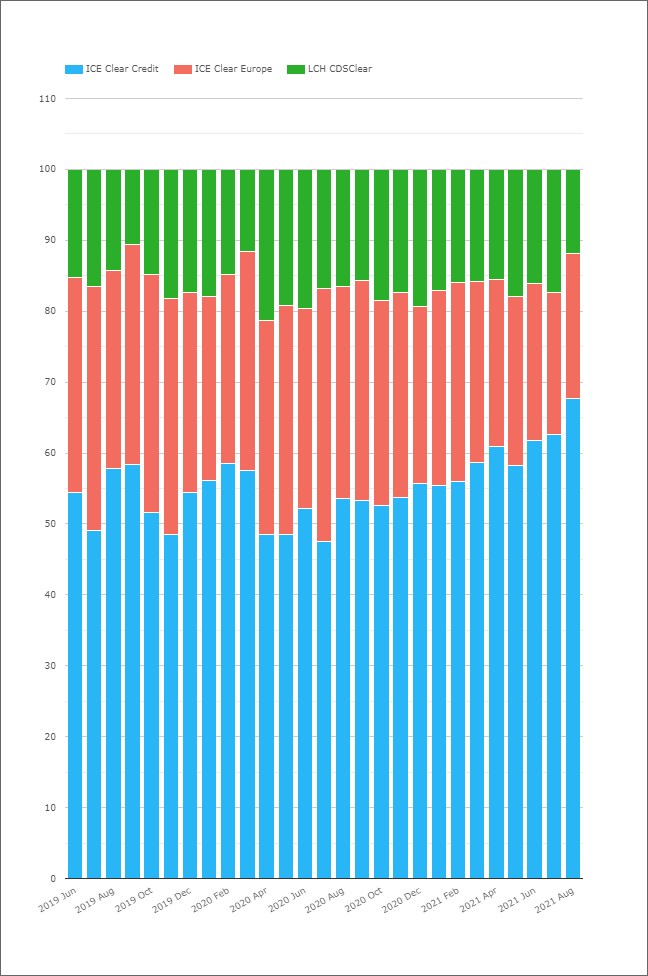
This appears to be another win for the US. A jurisdiction that implemented OTC market reforms faster then anywhere else and has the most transparent markets of any that we monitor. Just saying….
EUR CDS SEF Trading
Also in the credit trading space, we have seen huge growth in SEF traded volumes for EUR denominated CRD Index trades. Amir covered this in a February blog, and we have seen the trend continue:
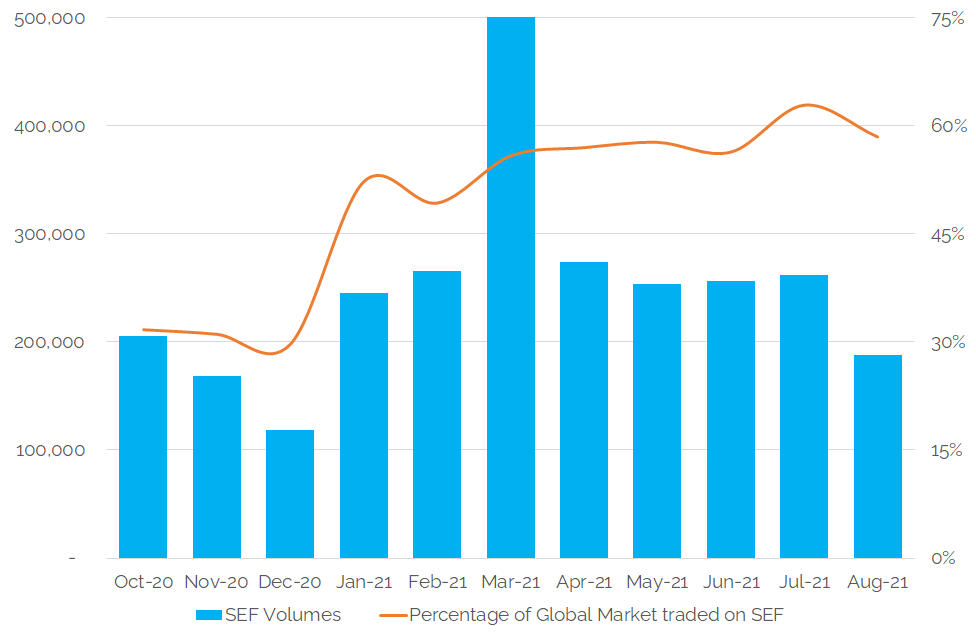
Showing;
- 55-60% of the global EUR CRD Index market now trades on SEF.
- This has increased from below 30% in 2020.
- On-SEF monthly volumes in EUR CRD Index trades now average over $250bn each month, up from $164bn from Q4 2020.
EUR IRS SEF Market Share
Finally, we can readily track the portion of global EUR IRS markets that are trading on-SEF using our APIs (microservices) which neatly combine SEFView and CCPView data sets.
This feature of IDB markets has really become entrenched this year since we first starting looking at in during January. We now see a solid 23% of the global EUR IRS D2D market executing on-SEF every month:
We’ve written extensively about the reasons behind this – basically Brexit. It would be interesting to see Markit (now OSTTRA) also update their original analysis.
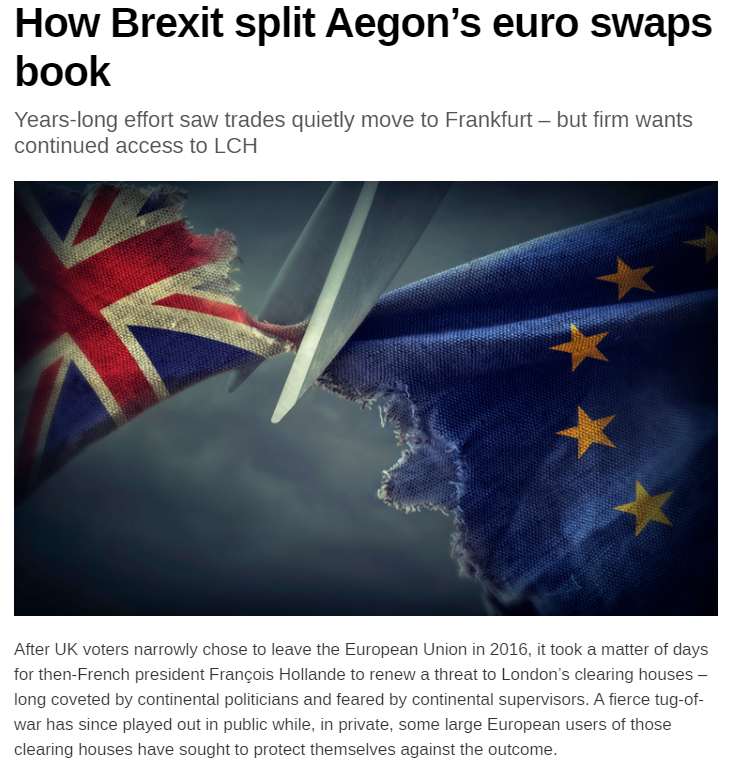
In Summary
- The EUR IRS market does not look to be in good health, recording the lowest monthly volumes for five years.
- Clearing has not moved significantly to European CCPs, with Eurex market share at 7-9% and pretty stable throughout 2021.
- There has been no increase in the amount of EUR CRD Index cleared in Europe.
- It is instead the venue of execution rather than the location of clearing that has been impacted by Brexit.
- 23% of global EUR IRS volumes now execute on-SEF, from zero last year.
- 60% of global EUR CRD Index volumes now execute on-SEF, up from 30% last year.