After shouting “HopSchwiiz” in my adopted nation waaaaaay too much at the football last night, I needed a somewhat low-energy blog this morning. Step forward our easy-to-use API, which has recently been extended to include data from both CCPView and SEFView.
Hopefully it’s not such a rollercoaster ride using the Clarus API 😛
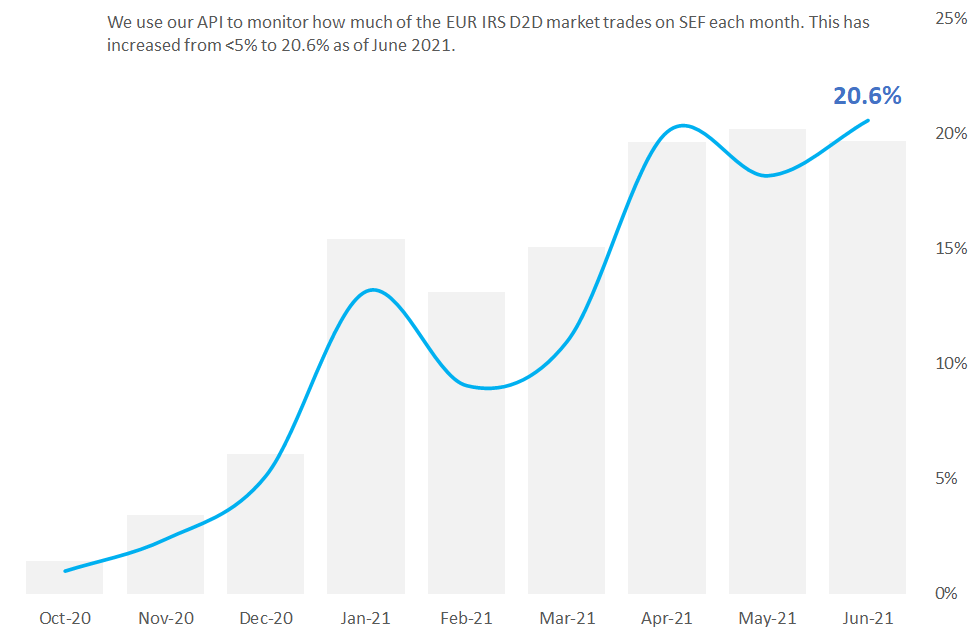
Brexit Moves Trading to SEFs
In case you’ve missed them, I’ve been writing periodic blogs showing how much of the D2D EUR IRS market has been moving on to US SEFs. This is largely due to the fact that only US SEFs enjoy equivalence with both UK and European regimes. A UK vs EU trade that is subject to the Derivatives Trading Obligation in the EU/UK therefore tends to occur on US venues. It’s weird, but this is the situation we find ourselves in right now.
I’ve produced a number of charts showing the uptake of SEF trading, including this daily chart for EUR IRS trading in the interdealer market:
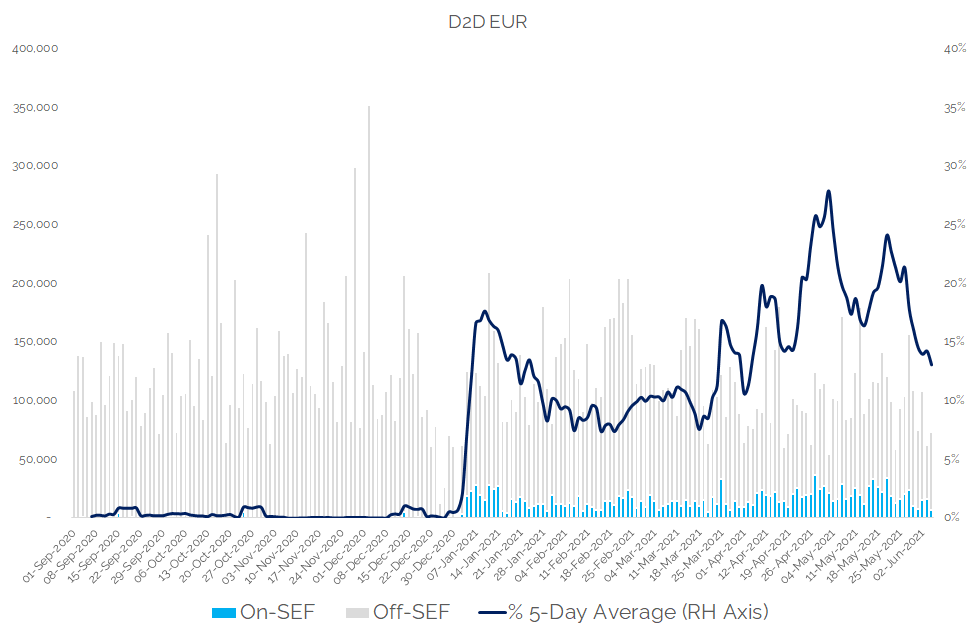
Showing;
- A daily time-series of notional traded on and off SEF for EUR IRS. It shows only the SEF volumes on dealer to dealer SEFs (IDB venues such as GFI, BGC, ICAP, Tullets).
- It measures these volumes as a proportion of the overall global EUR IRS cleared volumes reported by CCPs each day.
- We find that EUR IRS volumes on-SEF were basically zero before January 2021.
- They quickly ramped up to 15-20% of the market during January.
- The percentage of the global EUR IRS D2D market traded on any given day on SEF varies quite a lot.
API Please
Creating these daily time-series was quickly becoming unnecessary because:
- The data is volatile day-to-day.
- We now have six months of post-Brexit data to look at.
However, exporting CSVs from both CCPView and SEFView was getting a bit “clunky” just for this ad-hoc analysis. So I wanted to be able to combine outputs from both CCPView and SEFView. The answer? Our API that I can access easily via Excel.
It’s tricky to show an API “in-action” but I thought I should give some screenshots before I present the charts.
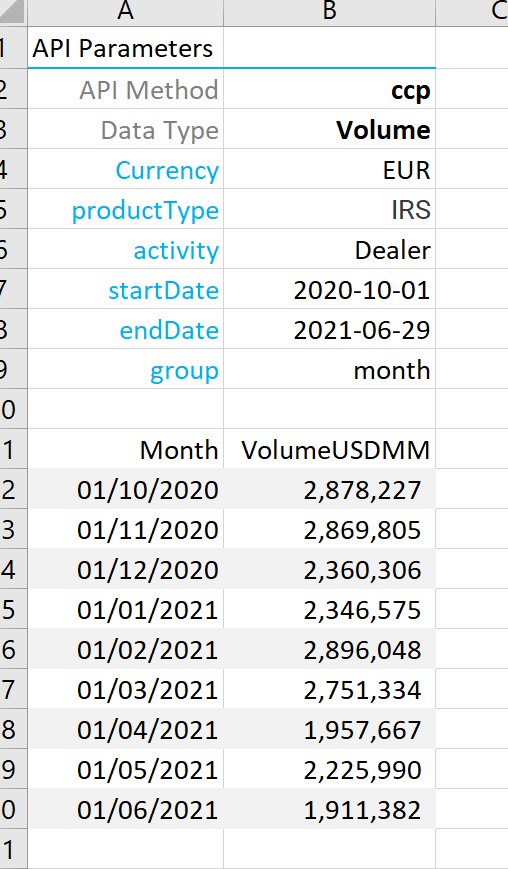
It’s pretty simple syntax:
- List out the parameters of the API call I am using. These can be found under our API documentation portal for the Clarus Microservices. To be honest, I’ve used CCPView and SEFView so much recently that I pretty much know the parameters I need to send – sad but true.
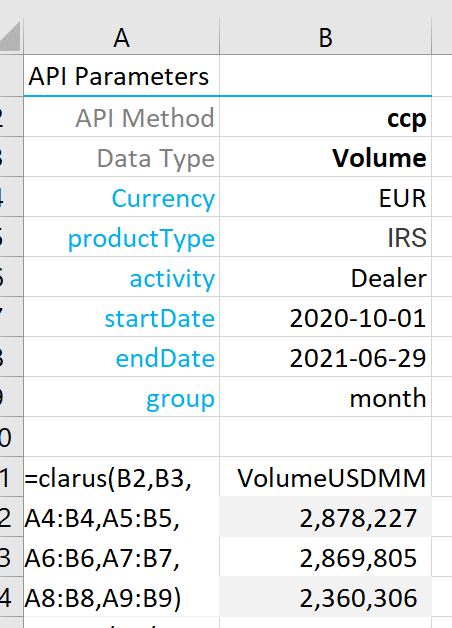
- Create an Excel Array Formula to pull in the results via our “Clarus” Excel add-in.
- My user name and password are already saved by Microsoft within Excel so I don’t even have to bother logging in, which is a nice user-friendly feature.
Charts
I can now open a single spreadsheet, with calls to both CCPView and SEFView, and see the proportion of the global EUR IRS D2D market that is trading on-SEF. Pretty neat.
Standard Excel chart:
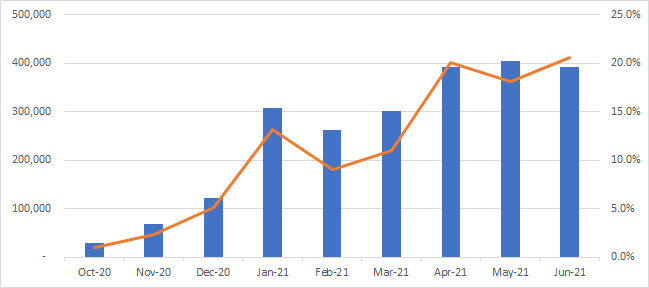
You can then of course follow Tufte’s guide to data visualisation to make this a bit easier on the eye:
In Summary
If we have found one thing during our time analysing transparency data in derivatives markets, it is that trading (or liquidity) is exceptionally “sticky”. Once it moves, it is very difficult to unwind that change. It makes it an attractive business to be in for trading platforms, assuming they can win volumes to start with. The SEF move seems to be gathering pace here, with more EUR IRS volumes traded each month on-SEF and a larger proportion of the overall global market transacting on-SEF each month.
We now see over 20% of monthly volumes in the global EUR IRS market transacted on-SEF. Will this continue to grow? What will the end state look like? Will EUR trading on SEF gain even more traction? Deutsche seem to like SEF trading for example:
And what about other currencies?
Other Asset Classes?
They are a simple change of cell in Excel away.
Sign up now to enjoy using the Clarus API to explore our data.