- SOFR trading now accounts for 30% of the USD market.
- This is as a direct result of the SOFR first initiative.
- Elsewhere, US markets have been in the midst of a Summer lull.
- Volumes outside of SOFR were around 15% lower than other weeks in 2021.
- We look forward to updating the ISDA-Clarus RFR adoption indicator early next week.
In previous times, I found that the hardest part of being on vacation was going back into the office afterwards. Now that we are all digital nomads, that has all changed. But it is undoubtedly now trickier to catch up on what has happened since you’ve been out without being able to rely on those random catch-up chats with colleagues.
For me, the first thing I did whilst on vacation was to actually write our SOFR First Live blog! Bad timing for my holidays, but it does give me something to revisit in my first blog back.
I also need to know what has happened in the overall Rates markets upon my return. That is why CCPView is typically my first port of call after any time out of the office. It covers the whole USD Rates market – UST cash bonds, Futures and OTC Swaps. If anything of particular interest has happened, I should be able to spot it in there!
SOFR First
First up it is SOFR First!
From our SDRView RFR application:
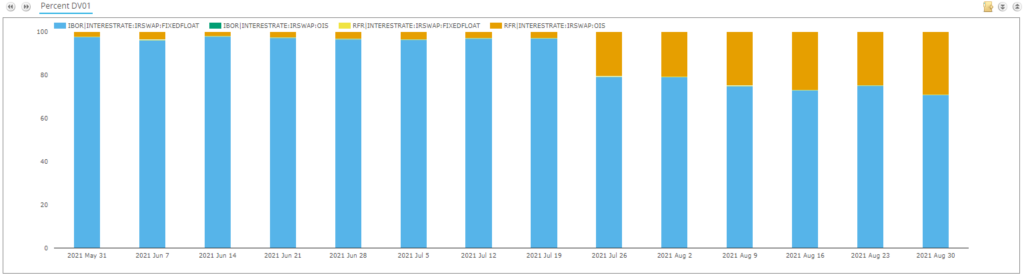
Showing;
- DV01 of SOFR swaps (OIS vs RFR in orange) and DV01 of LIBOR swaps (Fixed-Float in blue) as percentage of total.
- We can see that the orange SOFR bars steadily increased through August.
- They have plateaued around a 25-27% market share for a full week. This latest week suggests we may have even reached 30%. Let’s see if that feeds through into the full September data.
Has SOFR first therefore been a success? If we ballpark markets as 50% client activity and 50% interdealer activity, this data suggests that 50% of interdealer activity is now versus SOFR. That is impressive!
I also discovered that LCH now make weekly SOFR data available. I used this data in our response to the recent FCA consultation:
The latest SOFR data really does suggest all jurisdictions should be implementing clearing mandates and trading mandates in USD SOFR markets. I see no evidence in the data why this should not be the case?
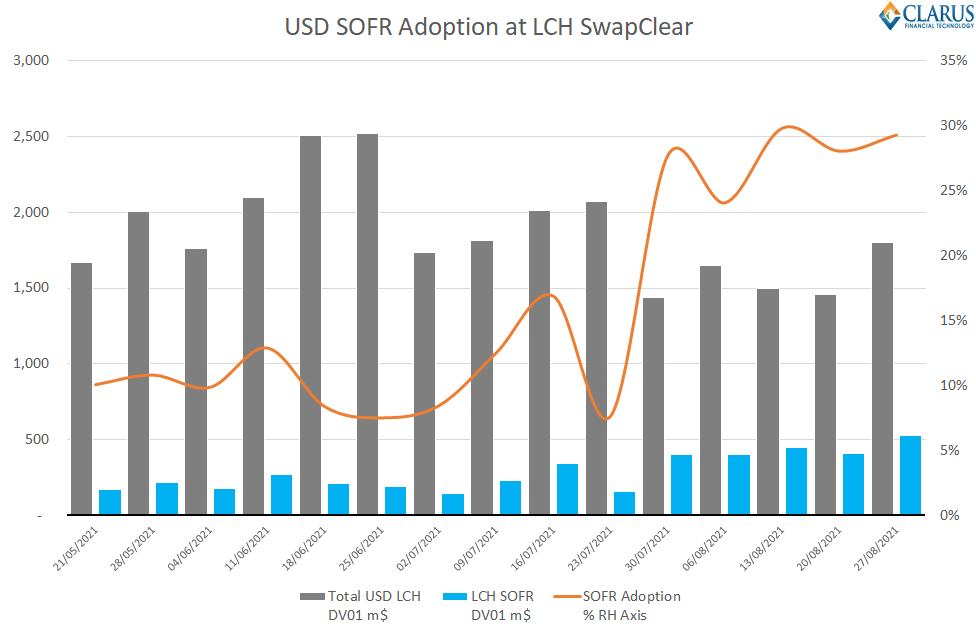
Showing;
- The global USD market cleared at LCH SwapClear and the proportion traded as SOFR each week.
- It tells a very similar story to the SDR US data.
- The data strongly suggests that 30% of the USD Rates market is now traded versus SOFR.
Now let’s move onto the overall USD Rates market.
Notional Volumes Traded
In CCPView, we have volume data for US Treasuries, exchange traded Futures and OTC markets. What did August look like compared to the rest of the year so far?
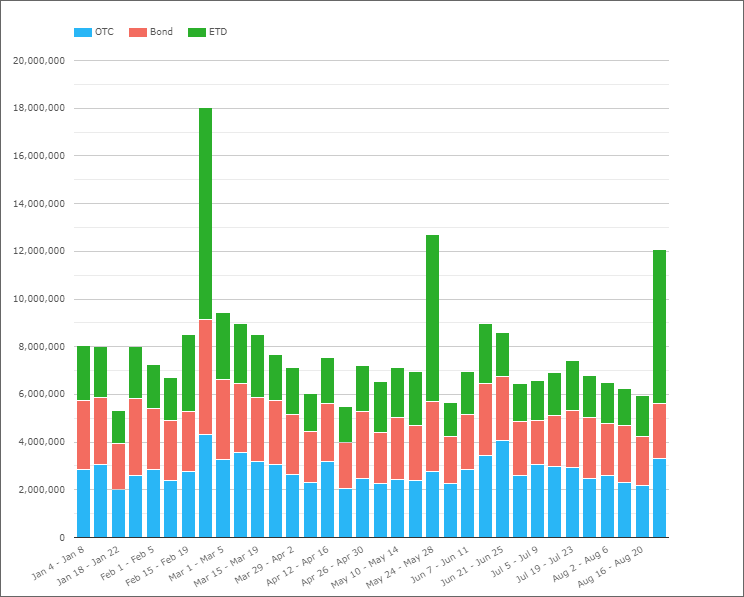
Showing;
- The three big volume peak weeks we see in 2021 (including August) are all related to the rolling of UST bond futures at CME in the final week of trading (March contracts are rolled to June, June to Sep etc). Let’s therefore ignore these from our analysis as these volumes are not price forming.
- Volumes were ~85% of typical 2021 volumes during each week in August.
- All of the August weeks were therefore in the bottom 10 volume weeks this year. The Summer lull was indeed in full effect! The last week of August saw the lowest volumes.
As the FT reported in the run up to the Jackson Hole event last Friday, liquidity was anecdotally reported as “lousy” in US Treasuries:
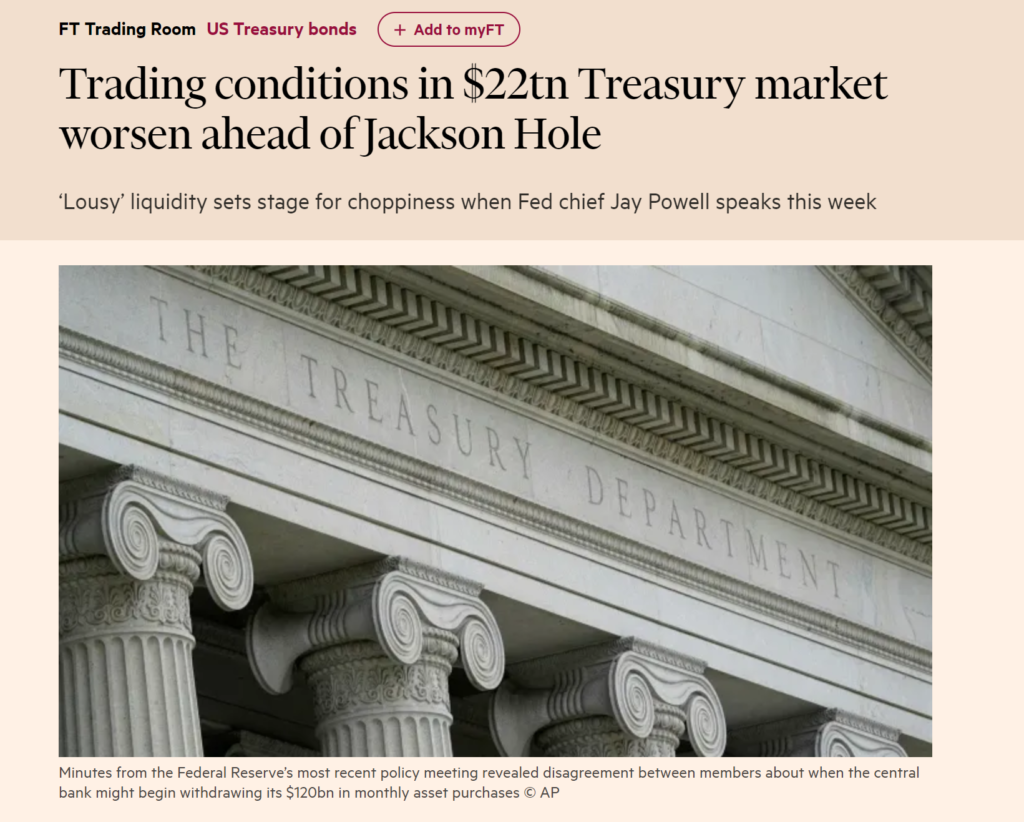
I’m not sure it is news that either a) August trading is difficult or b) that the US Treasury market is $22trn in size. I guess even the best of journalists fall victim to slow news in August too!
Tenor Data
As I continue to highlight on this blog, we have great transparency now for the tenors traded in the US Rates markets. It jumps out in the past week that, excluding bond futures, short-dated products saw record market share:
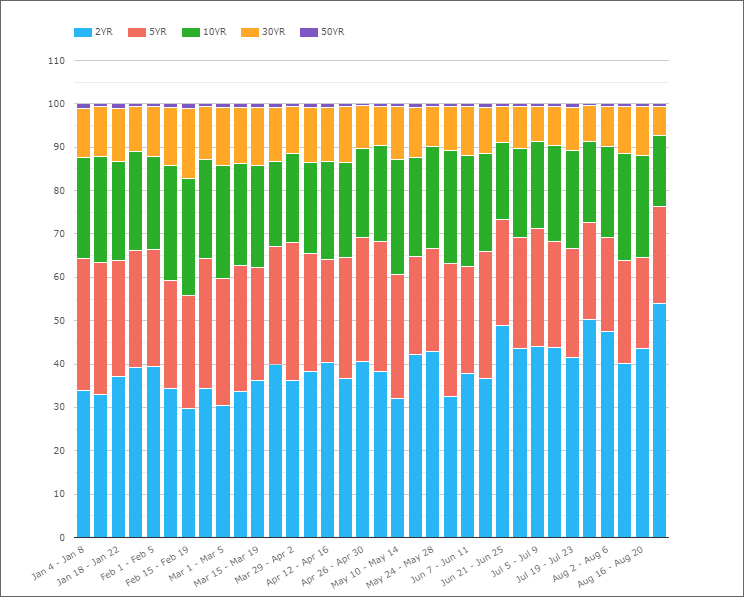
54% by notional was traded in products with 2Y tenors last week, a record for this year.
However, I think this is a little misleading. Taking a look at the volumes by product, it just so happens that Eurodollar futures saw a pretty average week, rather than falling as much as longer-dated products:
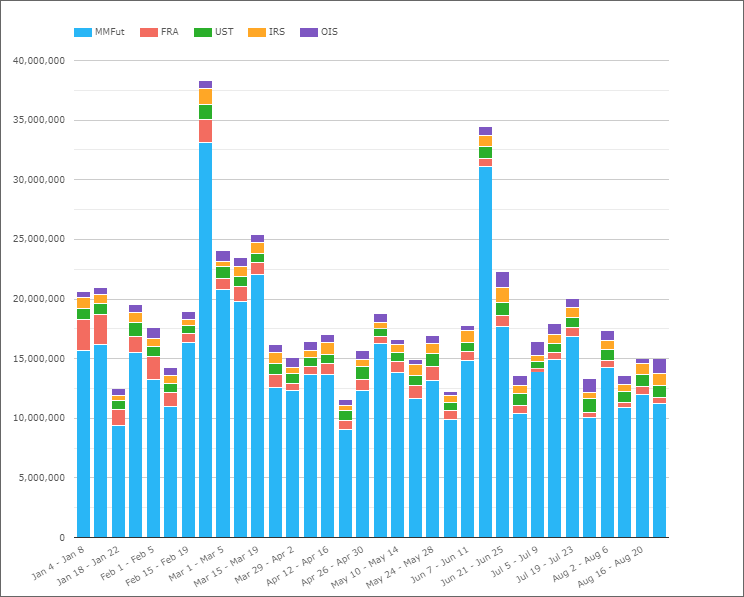
Unfortunately for this blog (!) when you look into the data, it looks as if August 2021 was largely a non-event in terms of volumes traded. The Summer lull was in full effect.
A Final Note on SOFR
With little to write home about for USD Rates (even Rates themselves have been fairly steady, in a 1.20-1.40% range for USSW10 since July), let’s at least look at the burgeoning SOFR market again.
We will have to wait for next week to confirm this, when all CCPs publish their monthly stats on RFR activity. However, using that same LCH SwapClear weekly data, it looks like August 2021 will be a record month for total SOFR risk traded:
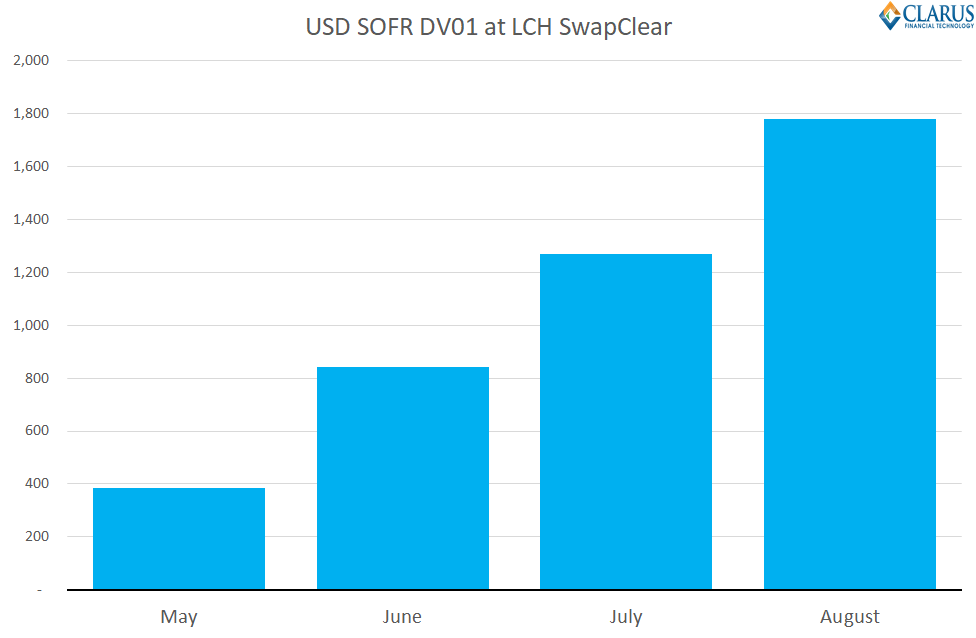
With overall volumes being so subdued, this suggests that the August 2021 ISDA-Clarus RFR Adoption Indicator, to be published next week, will see a significant uptick in SOFR adoption.
In Summary
- We are reasonably confident that SOFR risk now accounts for 30% of USD Rates markets.
- That is a really impressive jump from just 7% last month.
- We will update the ISDA-Clarus RFR Adoption Indicator early next week to confirm this result.
- Outside of SOFR, markets have been stuck in a Summer lull with nothing to write home about in terms of volumes traded in August 2021.