Whille writing my recent blogs on FX SIMM IM optimization (here and here), I wondered about progress on the Rates equivalent. I knew swaptions to be key and that Capitalab had focused on them from the get-go and also that Capitalab pipes executions through its affiliated BGC SEF.
So, I took at look in SEFView at BGC SEF volumes and found a clear-cut pattern which I surmised “must be Capitalab”. I’ll let the data tell the story.
Press
Before we look at the data, a couple of recent Capitalab press releases on its IR derivatives IM optimization services provide useful business context:
Feel free to read the links now or you can flip back to them when I refer to them later.
The Data
When I looked at SEFView BGC swaptions data, I found a distinct pattern:

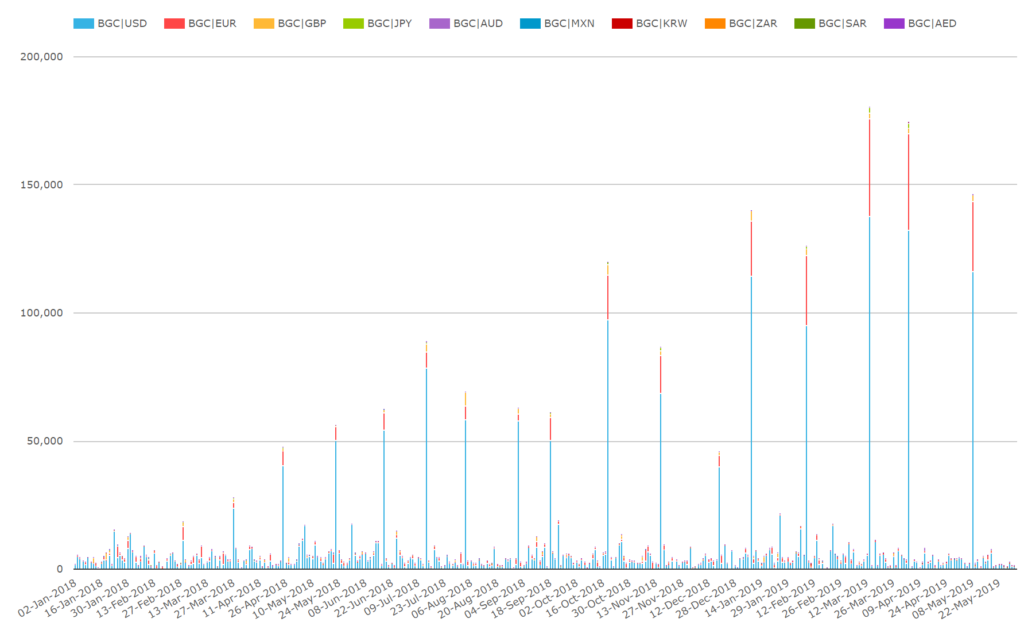
We see:
- Since Feb 2018 (or earlier), there have been roughly monthly volume spike days which far outstrip normal daily BGC SEF swaption volume
- USD, EUR dominate with GBP noticeable and JPY sometimes featuring.
Given the press releases also mention uncleared caps/floors and cleared IRS and FRA – presumably for CCP IM optimization, I wanted to look at all four products together.

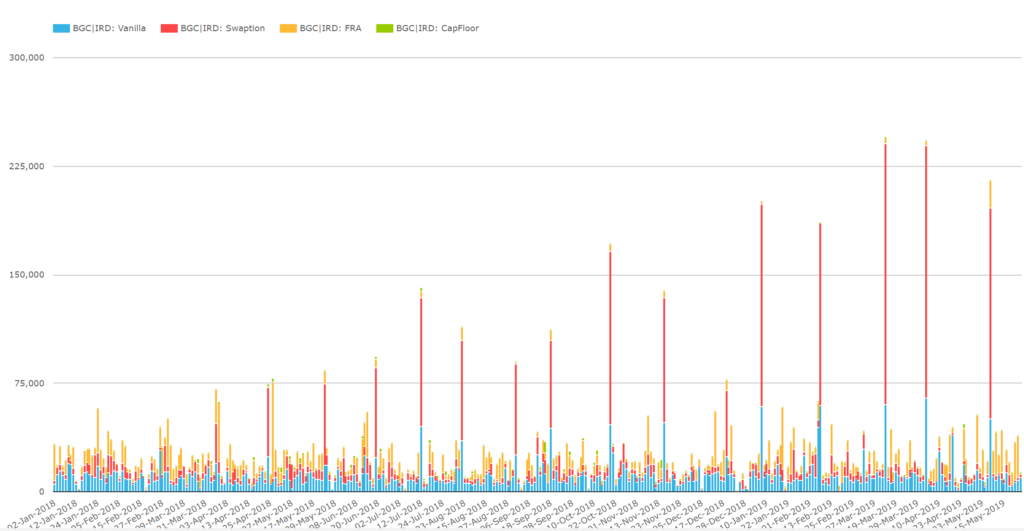
We can see:
- Clear-cut smaller vanilla swap spikes up to $60bn (blue bars) roughly 1/3 the size of the swaption peaks
- Caps/floors/FRAs don’t stand out on the peak days
The vanilla IRS are cleared and are intended both to optimize CCP IM and to offset any residual uncleared delta market risk created by the optimization of delta and gamma using options. Although noticeable in context of BGC SEF volumes, the IRS volume is a drop in the bucket compared with the entire cleared swap market.
Because trade notionals are capped in the SDR source data, an SDRView chart would under-estimate or confuse at this point when compared with SEFView. Instead I dropped the data from both sources into a spreadsheet to improve the comparison.

My extrapolations for comparison are somewhat crude but should be good enough for general sizing of activities. If interested, the extrapolations were:
- Capitalab SEF volumes – by backing out from BGC SEFView peak days total swaptions an average of BGC swaption volumes for other days in the month.
- Capitalab (global) Total volumes – by scaling up from Capitalab SEF volumes based on a 20%-40% range of non-US reported volume provided by Capitalab.
- US volumes – by scaling up SDRView volumes by the ratio of “SEF reported” to “SDR reported on SEF”.
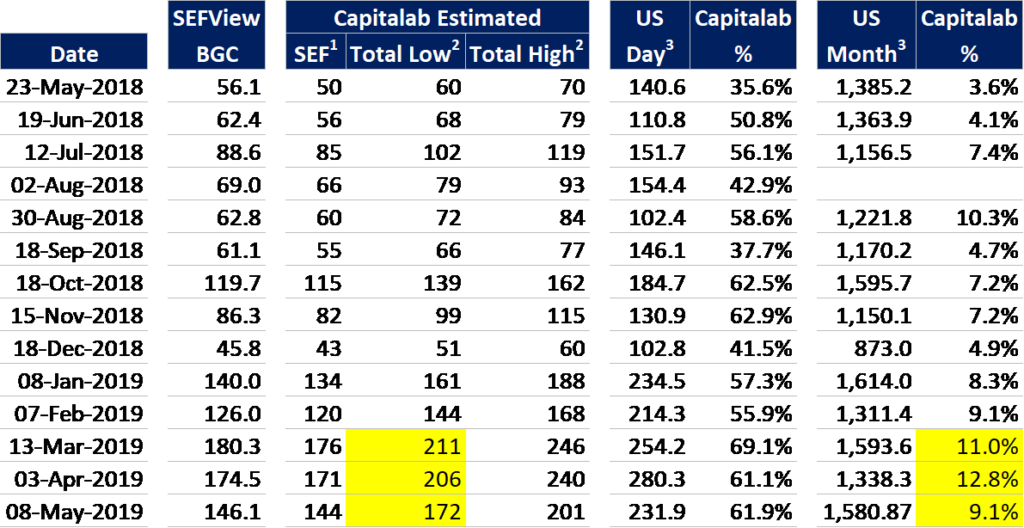
Note: the peak on SEF days lined up between SDRView and SEFView and I’ve picked out those days alone. We see:
- Capitalab global total notionals per run surpassed $200bn recently (highlighted).
- Capitalab SEF volumes grew from 7.2% to 12.8% of total monthly US swaption traded notional from October to April.
- (I chose to play down the run date share over 60% of US reported swaption notional, since the runs tackle optimization opportunities accumulated over approximately a month)
Capitalab kindly met us and subsequently provided confirmation these are their runs and some supplementary information. (Thanks, guys!). I included a few items not in the data in the summary below.
Capitalab also let us know that, while FX derivatives SIMM IM optimization already runs weekly at both TriBalance and Quantile, there seems little demand to move away from monthly for Capitalab’s IRD SIMM optimization. Evidently the longer average tenor of swaption portfolios and relatively low proportion of expiries in a given period render weekly frequency overkill.
Is there competition?
Yes. We know already that CCP clearing of OTC IR options became extinct at the end of 2018 per my recent blog. This leaves the field clear for IM optimization services.
Aside from Capitalab, TriBalance and Quantile have both been live with IRD SIMM IM optimization since 2017 with trades from both being executed off platform. Given they are executed off platform, we would expect competitor volumes to feature in the off-SEF bucket in the US SDRView volumes.

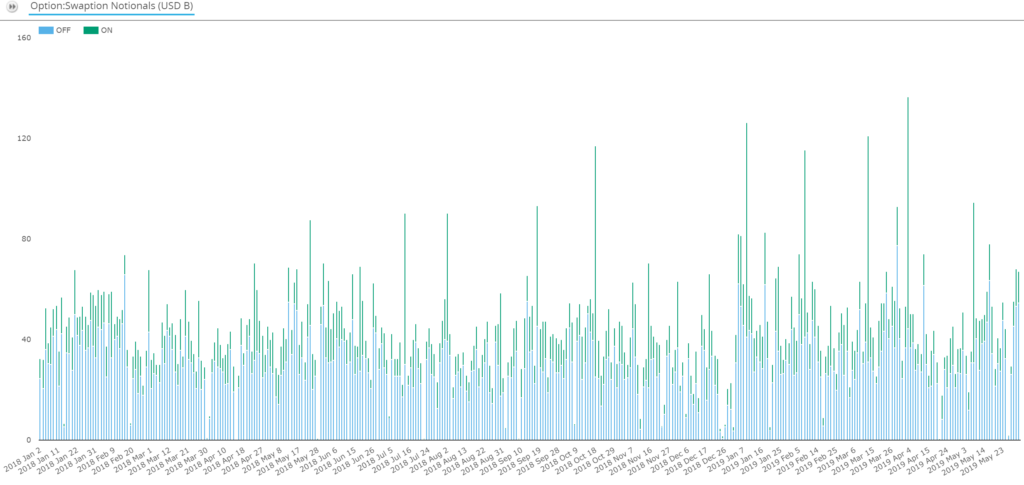
We can see:
- On-SEF (green bars): there are peaks corresponding to the Capitalab runs (I checked the dates)
- Off-SEF (blue bars): the competitors are in there but hard to isolate.
- There are some high volume off-SEF days – up to $50bn-$60bn – where most days are between $20bn and $30bn. Quantile or TriBalance could be quite material even if buried in there.
- I checked the 2019 subset of the data and discovered that the off-SEF peak day each month for the whole US market was comfortably lower than the on SEF peak for the Capitalab run date.
Presuming the competition also run monthly on one day, we can say their swaption trade volumes are lower than Capitalab’s. I would be grateful to receive further information from other players on run dates or volumes.
Capitalab’s Rates IM Optimization – a summary
- Monthly IM optimization runs generate new trades to offset cpty risk while keeping market risk constant. (If you want an outline and simple example – please see section 4 of my recent blog on counterparty risk reduction.)
- USD/EUR swaptions and cleared IRS dominate the volumes of new trades created. (Runs also include G4 currency uncleared swaptions, caps and floors, and cleared vanilla IRS and FRAs).
- Capitalab press releases note $3bn saved in April and $2bn saved in October, across SIMM IM and CCP IM – material when compared with ISDA margin survey figures.
- Public risk or IM reduction figures are not available in the granularity required to compare Capitalab against competitors for funding or RWA savings.
- Public notional volumes do provide a basis for comparison:
- Capitalab new swaptions exceeded $200bn per run in March and April
- Capitalab new swaptions exceeded 10% of the US reported market
- US reported on-SEF volume on Capitalab run dates exceeded the monthly peak day of the off-SEF market.
- Therefore, Capitalab produces more swaptions per run than the competition.
- Capitalab also compresses uncleared swaptions (through a separate service) e.g. $700bn notional outstanding was eliminated in September and October compared with $200-$240bn added in IM optimization runs.
Conclusion
In swaption notional executed terms, Capitalab has claimed top spot in IR SIMM IM optimization.
Information on how much SIMM or CCP IM has been saved by each multilateral optimization provider is only selectively publicized, so executed nationals are our best basis for comparison.
There is clearly healthy and committed competition from the established live services from Quantile and TriBalance and I welcome any specific notional volume or IM saved statistics from them.
In an upcoming blog, I aim to summarize together Rates & FX IM optimization and compression vendor positioning as well as putting compression in the context of the global H2 2018 change in notional outstanding (uncleared from BIS and cleared from CCPView).
Please look out for that.