We recently covered SOFR Swaptions – Week One Update and SOFR First in Swaptions, and now that we have November volumes, I wanted to update what the data shows.
November 2021 – SOFR Swaptions
In SDRView Researcher, we select USD Swaptions and categorize by reference index as IBOR or RFR.
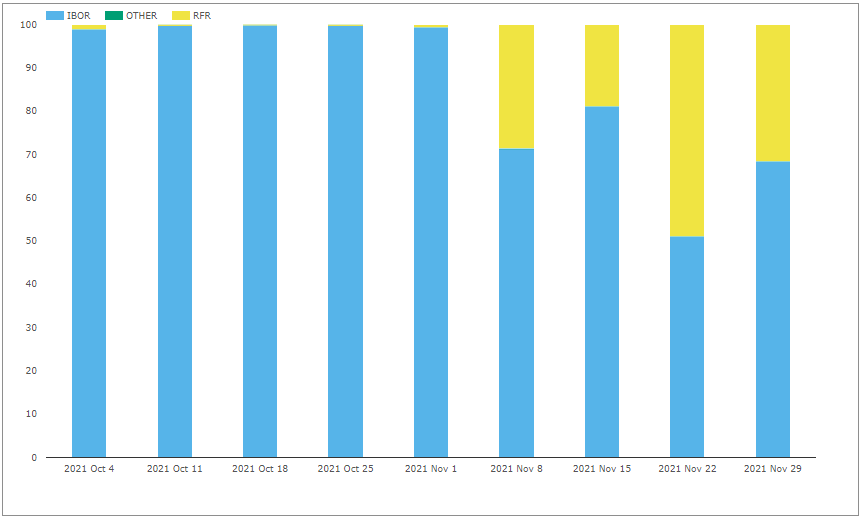
Showing the jump to 29% of notional as SOFR in the week starting November 8th, 19% the following week, then a high of 49% in the week of November 22nd and 32% in the two days this week.
In trade count terms the equivalent percentages are 22%, 19%, 61% and 31%, so pretty similar.
Switching to gross notional by month.
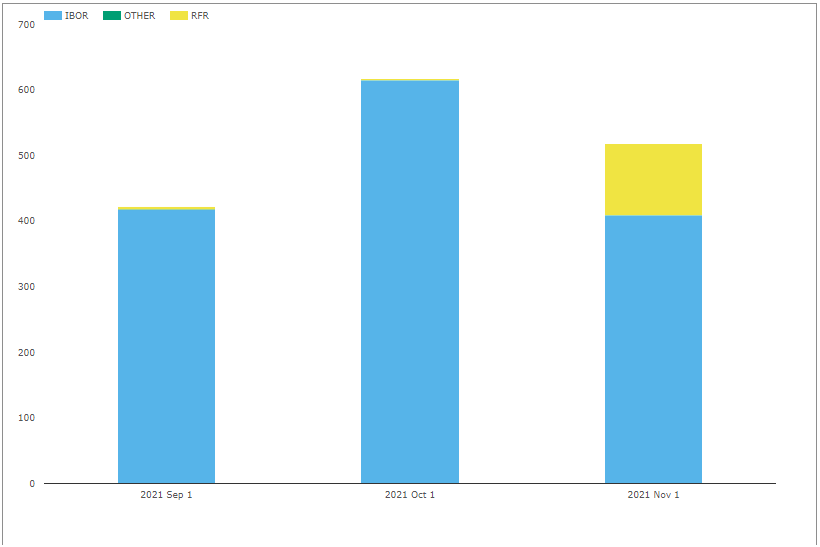
Overall volumes in November at $520 billion, lower than the $620 billion in October, not surprising given the US holidays in November, with a clear increase in SOFR from under $4 billion a month to $110 billion in November.
November 2021 gross notional percentages are then 21% SOFR and 79% IBOR.
Recall that these notionals are subject to capped notional rules, resulting in an understatement of the actual notional transacted. Infact of the $110 billion of SOFR Swaptions, $68 billion is from standard trades (lower than capped notional), while $42 billion is the sum of trades each of which have been capped at specific notionals; so this latter portion will be significantly higher.
Next lets first further categorize our volume into Ref Index and On/Off SEF.
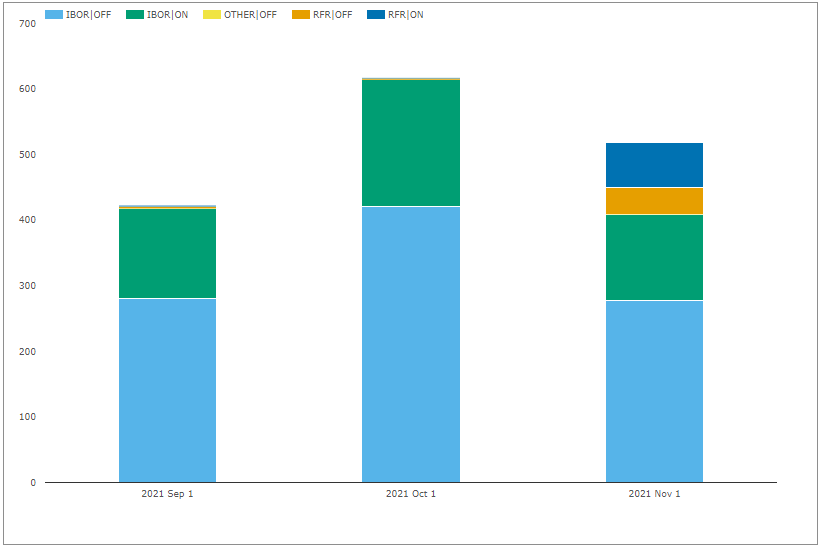
USD Swaption gross notional by Ref Index and On/Off SEF
Showing that in November 2021:
- IBOR Off SEF was at least $278 billion
- IBOR On SEF was $132 billion
- SOFR On SEF was $70 billion
- SOFR Off SEF was $40 billion
As expected a much higher portion of On SEF volume is SOFR than the Off SEF volume, given the priority set for Dealers by the SOFR First Initiative. Let’s now look in more detail at the On SEF volume.
Swaptions on Swap Execution Facilities
In SEFView, we can select Swaptions and categorize by IBOR and RFR.
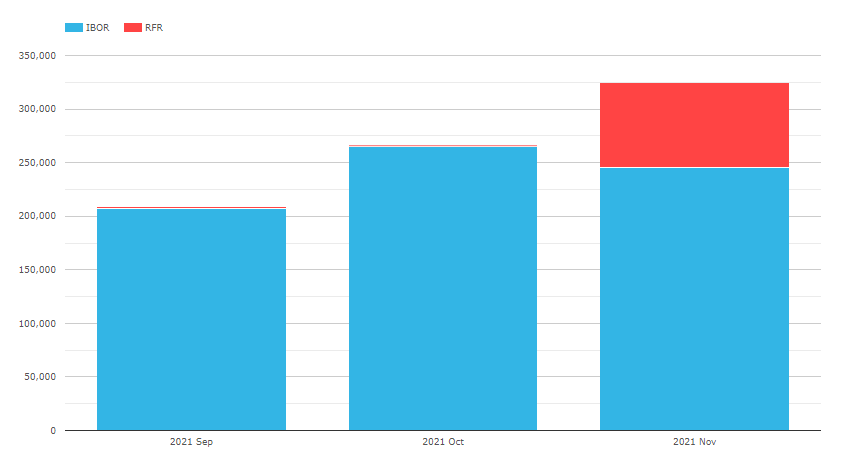
On SEF USD Swaptions IBOR vs RFR
Showing the jump from less than $2 billion of SOFR Swaptions a month to $79 billion in November (Note this excludes one SEFs volume from 30th November, which was not available at the time of writing this blog).
So November Swaptions volume was $245 billion IBOR and $79 billion IBOR.
This compares to the SDR On SEF Volume of $132 billion and $70 billion respectively, telling us that as a consequence of SDR capped notional rules, IBOR volume is more significantly understated than RFR, which must be due to much larger notionals transacted in IBOR than RFR.
The SDR data for On SEF in November, implies a share of percentage share of 35% for SOFR, from $70b SOFR and $132b IBOR.
While the SEF data, based on actual notionals, implies a share of 24% SOFR, as $79b SOFR and $245b IBOR.
While there is some Swaptions volume at Tradeweb, a D2C SEF, the vast majority (99.5%) of Swaptions volume that is On SEF is on D2D platforms.
Selecting just SOFR Swaptions, we can see the volume by month for each SEF.
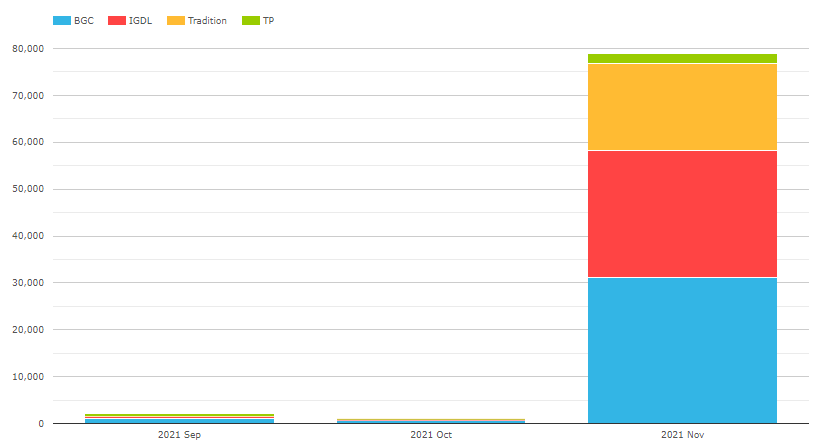
November has BGC with $31 billion, IGDL with $27 billion, Tradition $19 billion and Tullet $2 billion.
(Note the BGC figure includes volume generated by the CapitalLab optimization process, so their true price forming volume is much lower).
It will be interesting to see how these shares develop and if they end up as the same as they were for LIBOR Swaptions.
Product Comparisons
Finally before we end, let’s compare IBOR v RFR volumes in Swaptions with a few other products, which we can easily do in SDRView, using the IBOR-RFR View.
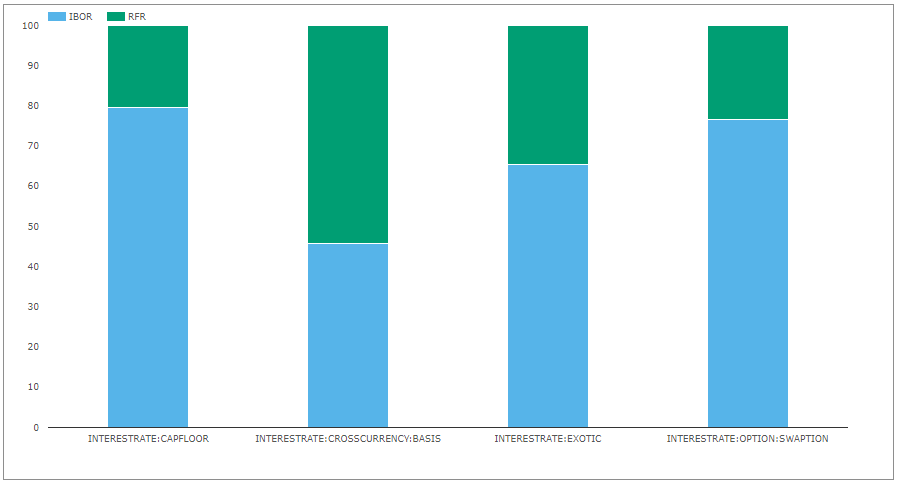
Showing:
- CapFloors with 80% IBOR and 20% RFR, out of a total of 913 trades
- Cross Currency Basis Swaps with 46% IBOR and 54% RFR, a total of 3,779 trades
- Exotic with 65% IBOR and 35% RFR, a total of 544 trades
- Swaptions with 77% IBOR and 23% RFR, a total of 3,919 trades
Interesting that both Cross Currency Swaps and Exotic have higher RFR percentages than Swaptions.
Cross Currency Swaps, we covered recently in Mechanics and Definitions of RFR Cross Currency Swaps and noted that for the major currency pairs, volume had moved decisively to RFRs.
The Exotic category, covers a number of product types that are hard to categorise using the public dissemination fields, but many include optionality and a point to note that as well as the 544 trades above, there were 710 in Other Indices e.g. FedFunds, ISDA-Swap-Rate and Muni.
CapFloors with a similar RFR percentage to Swaptions.
That’s all for today.
We will keep an eye on how RFR volumes in these products.