Eight weeks and six follow-on blogs later, my CME-LCH Basis Spreads blog continues to be one of our most popular blogs with a high number of daily views.
So I thought it was high time I revisited the SEF volumes to see what the data shows for CME-LCH Switch trades.
First a note to make you aware that we added a new category on our blog page, to bring up a list of all our blogs on this topic; see the Category: CME-LCH Basis.
Trade Volumes
Last time I looked at the 12-day period between 30 April to 15 May 2015 and we saw that Tradition reported $13.5 billion of CME-LCH Switch trades, ICAP reported $9.5 billion and Tullets $2.7 billion.
So lets look at the numbers from 18 May onwards.
In SEFView we now have a filter for Derivatives Clearing Organisation (DCO), which we can use to select only CME USD IRS by week for the last 8 weeks starting May 18, 2015.
(This will show volumes reported by a SEF that is cleared at CME and doing this just for the D2D SEFs we will find the CME leg of a CME-LCH Switch trade. The assumption being that there is none or very little outright CME trades on the D2D SEFs and all/vast majority is CME-LCH Basis.)
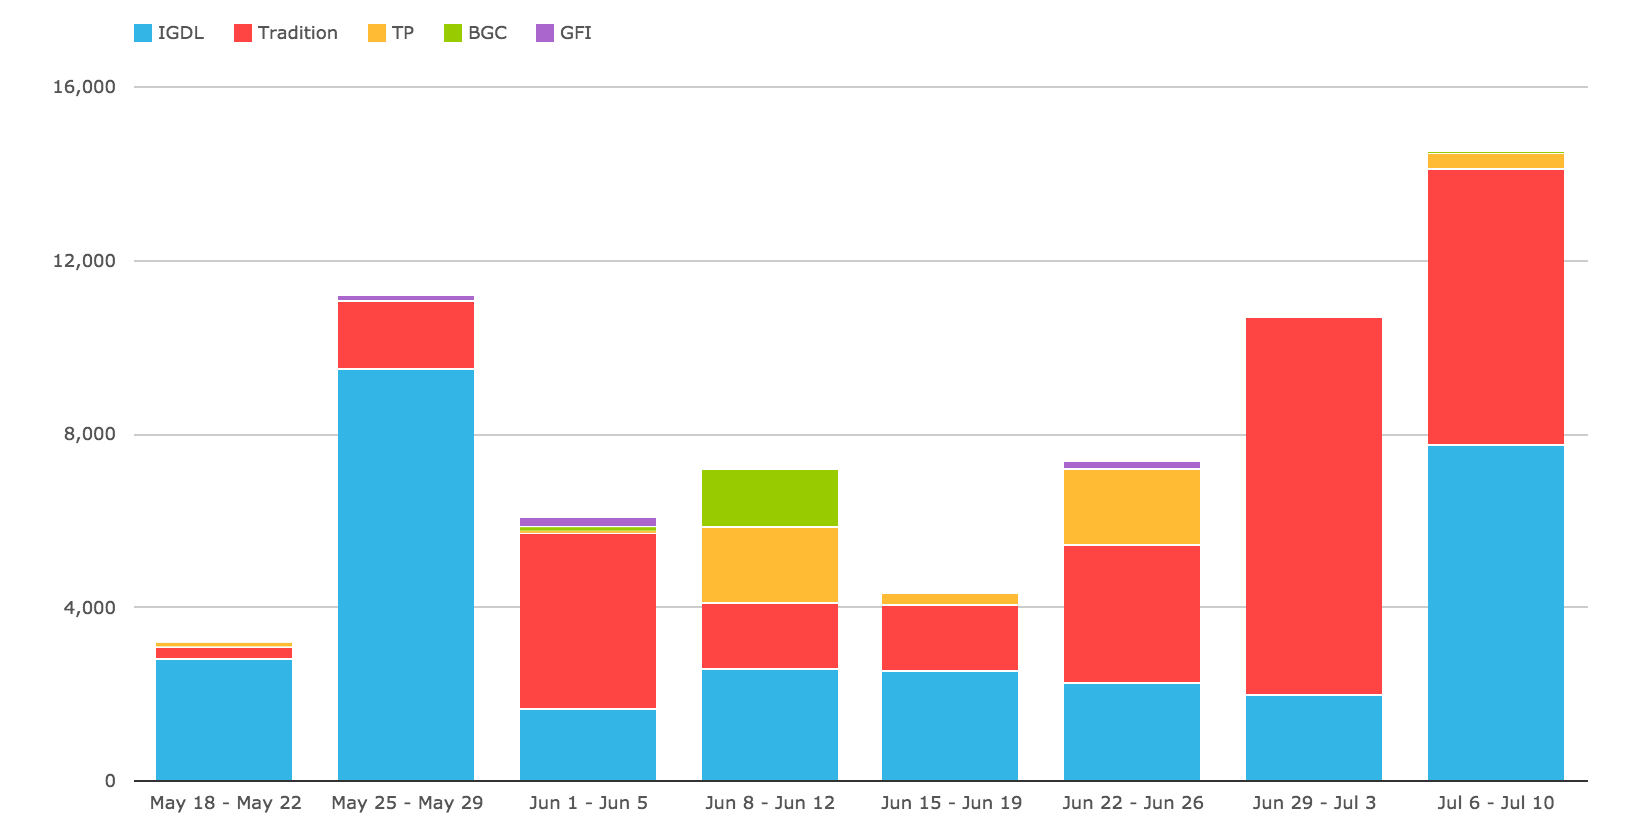
Which shows ICAP (IGDL) and Tradition vying each week for the largest share.
On overall volumes, we see that:
- $64 billion traded over the 8 week period
- An average of $8 billion a week
- With a low week of $1.6b and a high of $14.5b
- The high was the most recent week of 6 Jul
The same as a table of numbers.
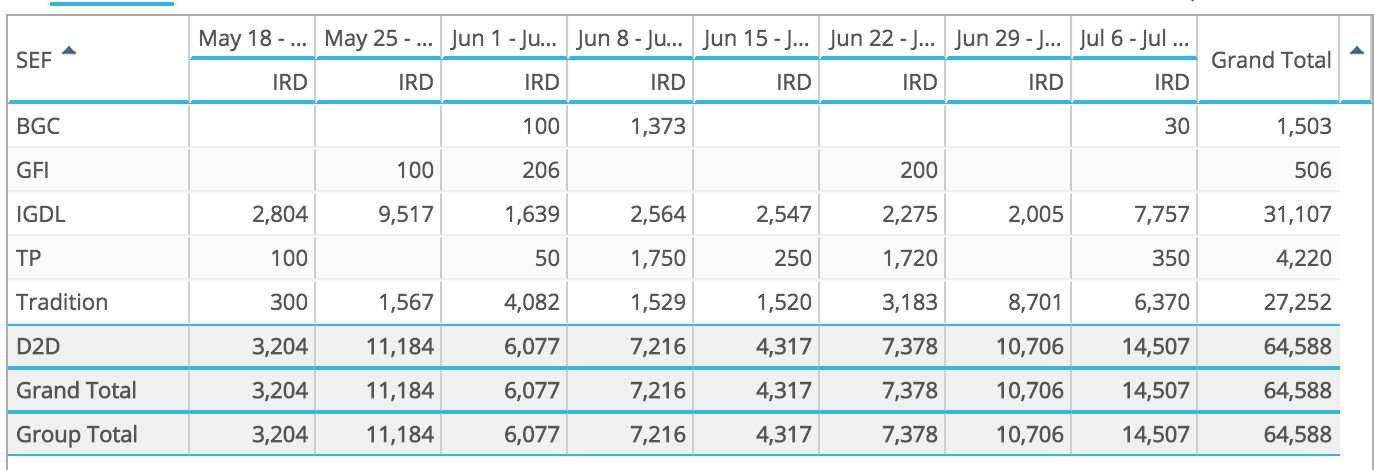
Showing that:
- ICAP (IGDL) has the largest volume over the period at $31 billion
- Tradition is close behind at $27 billion
- ICAP was top in 5 out of the 8 weeks, while Tradition in 3/8
- Single week high for ICAP was $9.5 billion, while for Tradition it was $8.7 billion
- The most recent week of 6 Jul had the highest overall volume
- Tullets show $4.2b and BGC/GFI $2b over the period
We can also look at the tenor of these trades by as below.

Showing that a wide range of tenors have traded with 5Y and 10Y being the largest with over 50% of the volume.
Followed by 30Y, 7Y, 3Y, 4Y, 2Y, 15Y and 9Y in duration weighted order.
Basis Spread Prices
And what of the CME-LCH Basis spread price itself?
Lets look at the quotes of 14 July from ICAP and Tradition.
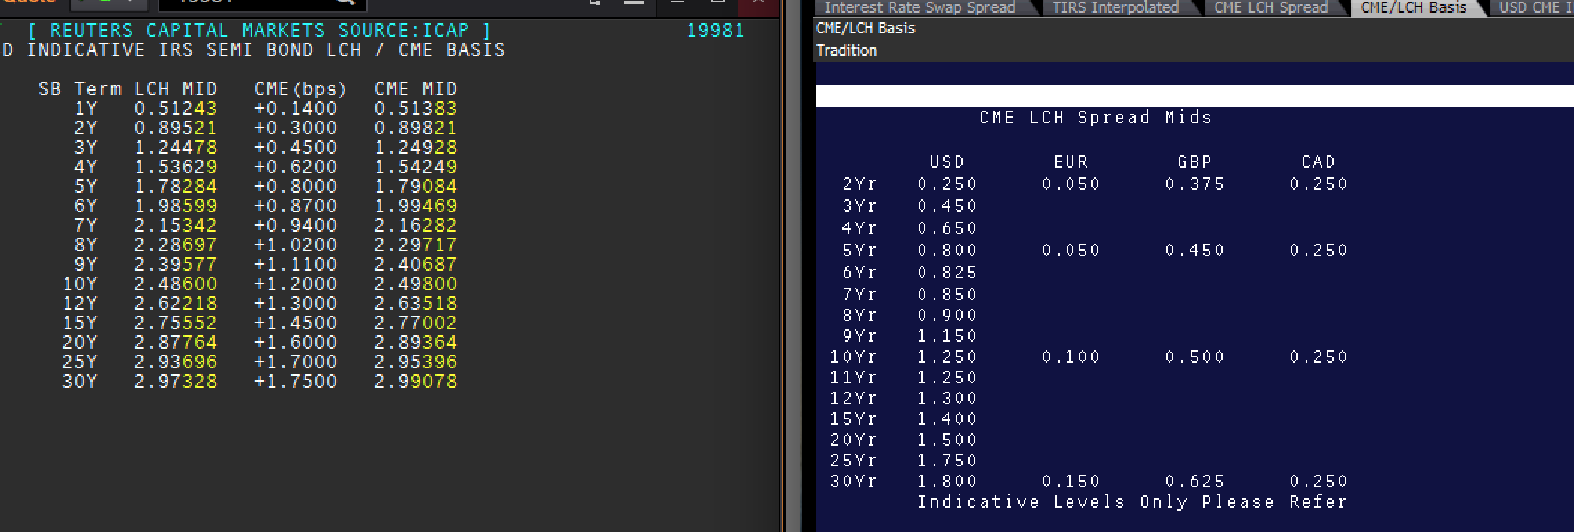
Showing that 5Y is 0.8 bps, 10Y is 1.20/1.25 bps and 30Y is 1.75/1.80 bps.
Certainly lower than spreads we observed on 26 June, which were 5Y at 1.25 bps, 10Y at 1.75 bps and 30Y at 2.45 bps.
So a tightening of 0.50 bp and with this price volatility, we should continue to see more volumes.
Also note that Tradition are now quoting CAD in addition to EUR & GBP.
CME LCH Cleared USD Volumes
And what of the USD IRS volumes cleared at CME and LCH?
Using CCPView we can compare LCH Client with CME USD Swap volumes.
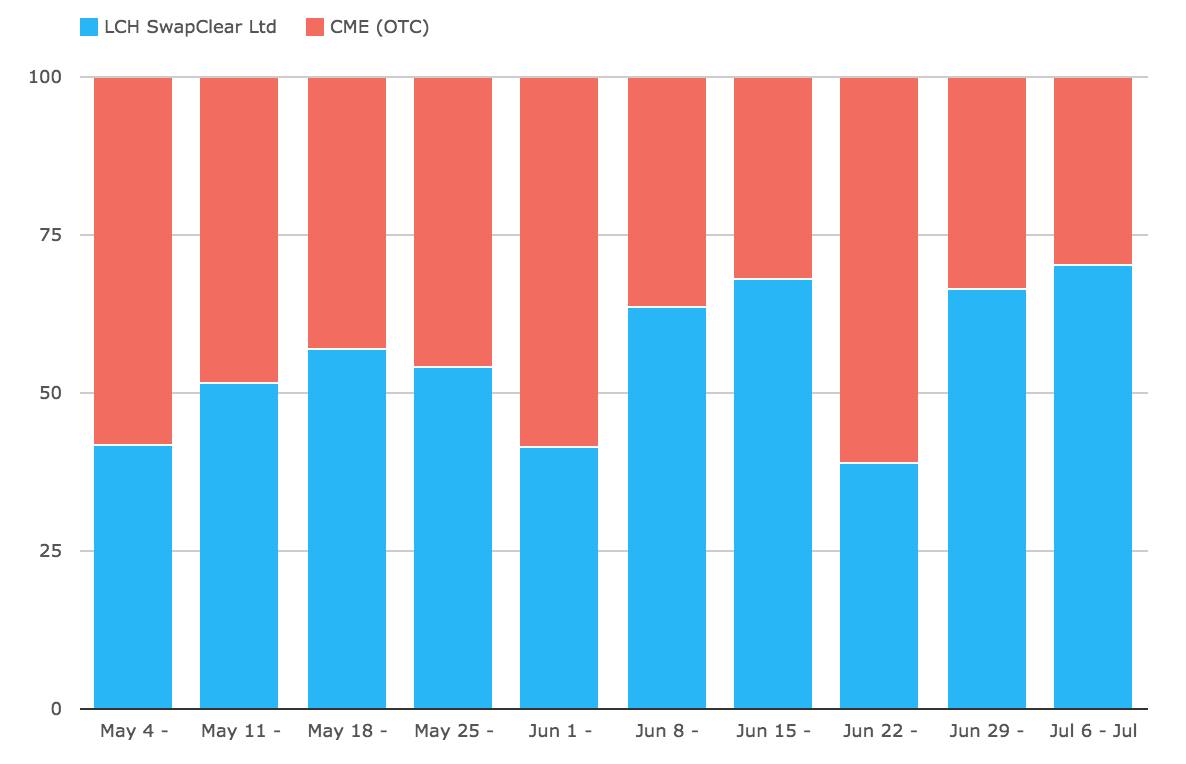
Showing that volumes continue to fluctuate each week.
LCH making gains over the past 10 weeks and achieving a high of 70% last week.
Summary
CME-LCH Basis Swaps continue to trade.
Weekly volumes have averaged $8 billion over the past 8 weeks, a cumulative $64 billion.
The Basis Spread has tightened 0.50 bp in recent weeks.
ICAP and Tradition are battling it out for the top spot.
LCH continues to make gains over CME in Client USD IRS.