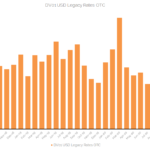
New Brexit Rules Move $4Trn Of Derivatives To The US
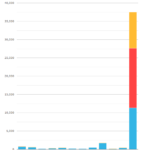
Brexit has moved over $4Trn in derivatives out of UK/European execution venues and onto US SEFs. Interdealer volumes in EUR and GBP products executed on US SEFs have increased by ~10 times in 2021. This is a consequence of certain products subject to a Trading Obligation in Europe (and the UK) executing on US registered […]
3 New Fed Fund Charts You Need to See
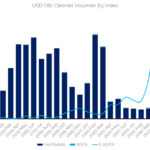
$2.5trn in OIS swaps versus Fed Funds were executed in December 2020. This compares to $364bn for SOFR OIS. We run through the data for the global market, the US market and the basis swap markets. As we continue to compile data for our response to the IBA Cessation of LIBOR consultation, a natural question […]
What’s new in CCP Quant Disclosures – 3Q20?
Clearing Houses just published their latest CPMI-IOSCO Quantitative Disclosures, which are for the quarter ending 30-Sep-2020, so lets look at what’s new in the data. Initial margin for IRS down 3% from the high on 31-Mar-20 Initial margin for CDS down 7% from the high Initial margin for ETD down 13% from the high Each as expected given the lower price volatility ASX and […]
2020 CCP Volumes and Market Share in IRD
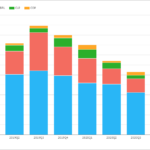
In this article I look in detail at the 2020 volumes and market share for OTC Derivatives in Interest Rates reported by Clearing Houses. Clarus CCPView has daily volume and open interest data published by each CCP, which is filtered, normalised and aggregated to allow meaningful comparisons of volume and has been used to produce all the charts below. Table of […]
Cessation of LIBOR: Why is so much new risk still being transacted?
Q4 2020 saw $7.0bn DV01 of new USD-LIBOR* linked activity written in OTC derivatives markets. It is a similar story in GBP ($4.5bn DV01), JPY and CHF markets. Why is so much new risk being written against these indices when they are due to cease imminently? Responses to the IBA consultation on a possible cessation […]
Cross Currency Swap Review 2020
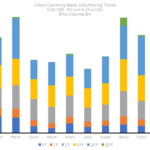
I was fortunate enough to be able to write about Cross Currency Swaps a few times during 2020. At the height of the market turmoil in March and into April, I wrote about: Cross Currency Swaps Trading During a Crisis Mechanics of Central Bank FX Swap Lines Central Bank Responses to COVID-19: FX Swap Arrangements […]
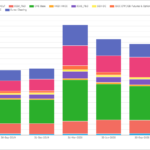
2020 SEF Market Share Statistics
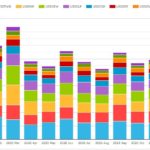
In this article I look at 2020 Swap Execution Facility (SEF) market share for Credit, Foreign Exchange and Interest Rate Derivative asset classes, in a similar format to my 2019 SEF Market Share Statistics. Summary: CRD Index, Option and Tranche products Volume in USD up 17% and in EUR up 12% March 2020 a huge month […]