My earlier article on Mexican Peso Interest Rate Swaps looked at the trade volume, both On and Off SEF and noted that CME were going offer Clearing for these. So almost exactly one year later, I thought it would be interesting to look at what the data show.
Weekly Volumes
Lets start with weekly volumes using SDRView Res, for the corresponding 3 month period in 2014 that we looked at in 2013.
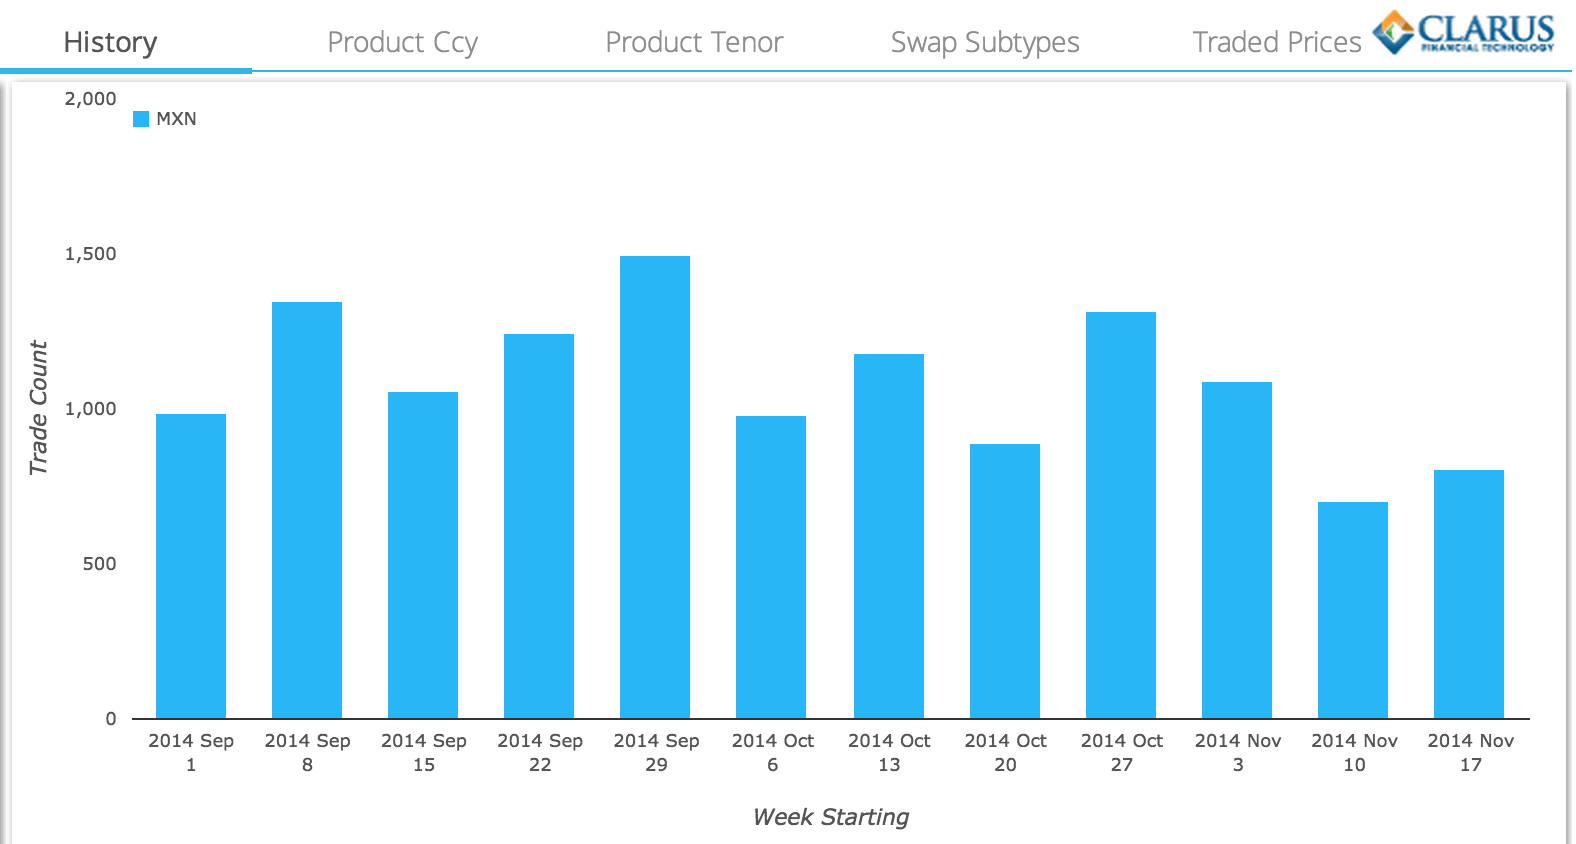
From this we can see that for the period 1 Sep to 21 Nov 2014:
- The average number of trades in a week is 1,092, compared to 750 in 2013.
- Or the average per day is 218, compared to 150.
- In our period the highest week had 1,500 trades and the lowest 705, compared to 1,072 and 503.
- The highest single day was 15 Oct with 447 trades, compared to 17 Oct with 688.
And what about gross notional?
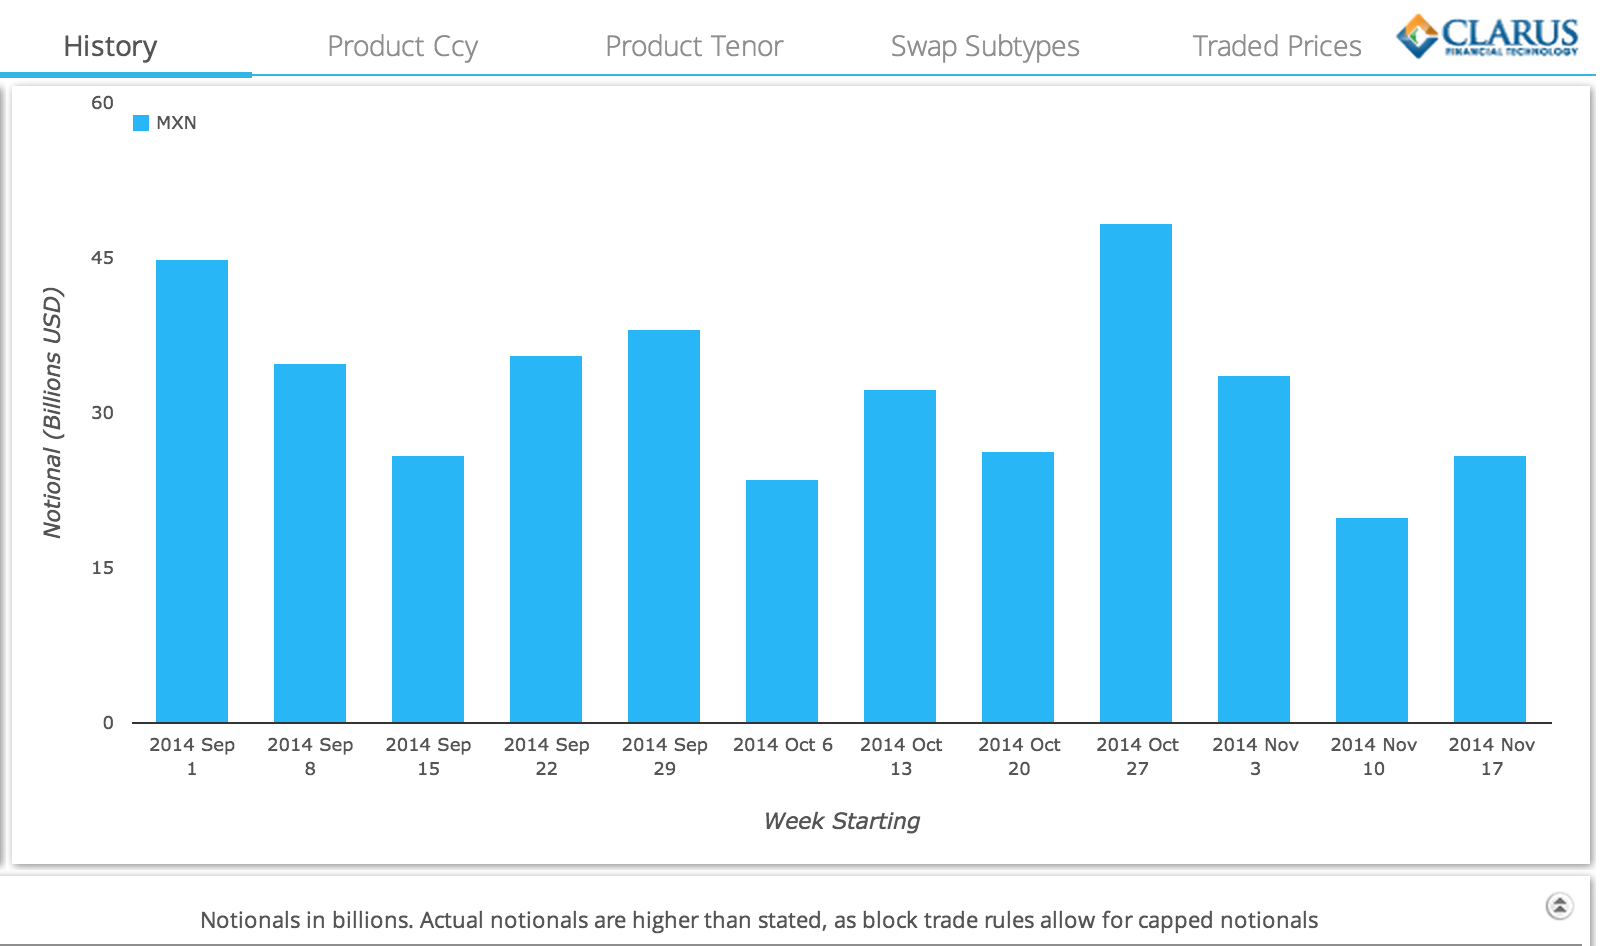
Which shows that:
- On average more than $32 billion in a week or $6.5 billion a day trades.
- The comparative figures for 2013 are $15 billion and $2 billion.
- So the volumes in Sep to Nov are more than double the prior year.
ON SEF
Lets now look at the On SEF volumes:
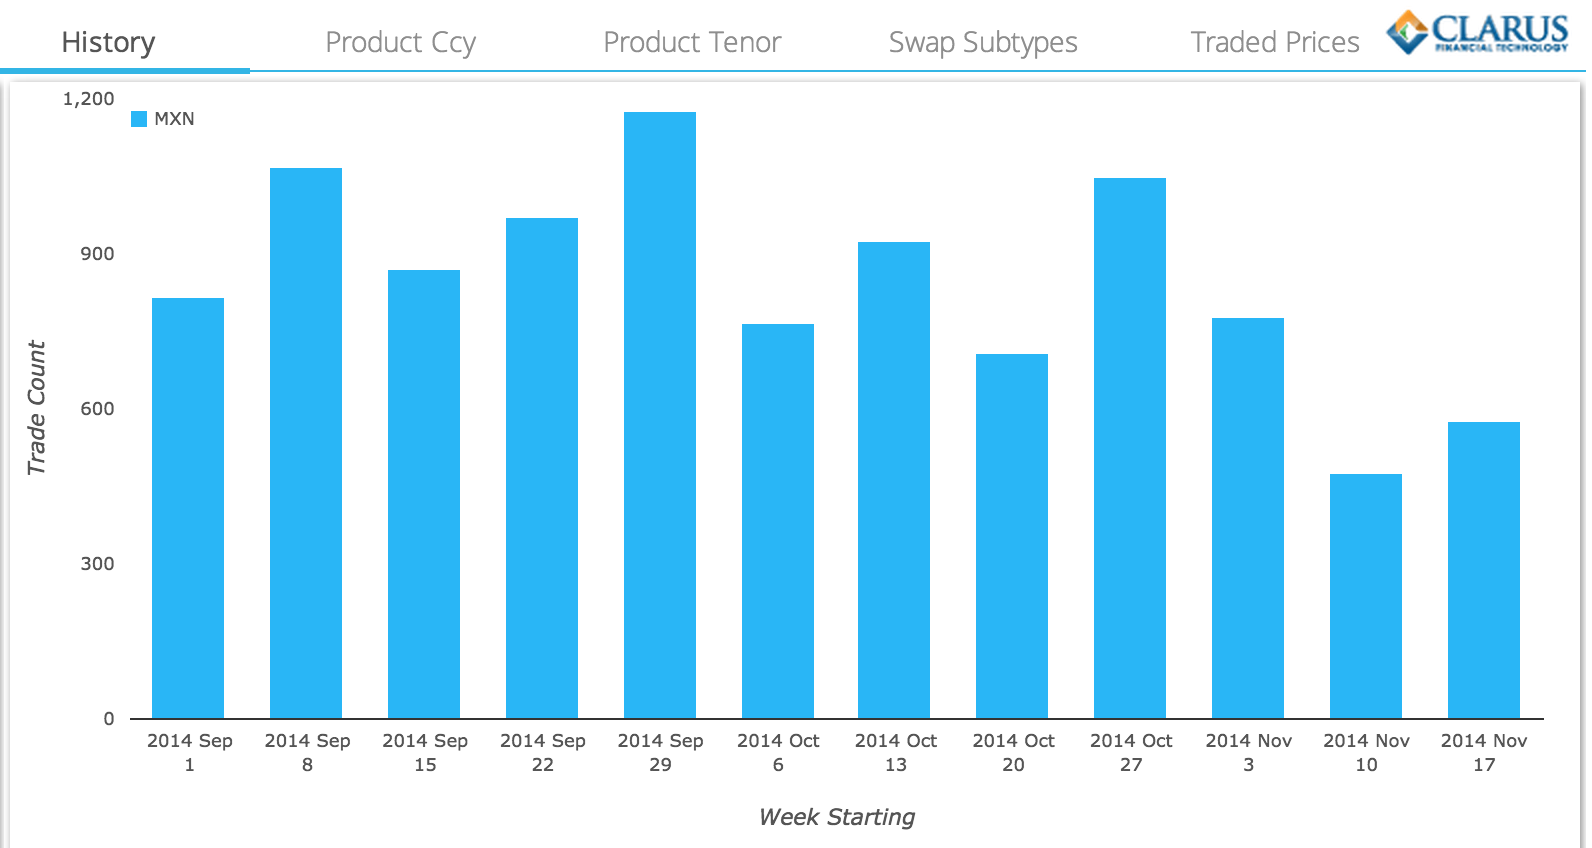
Which comparing to the first chart in the article, shows that the majority of trades (by US persons) are executed On SEF. And this without any mandatory requirement to execute On SEF. Lets look at the percentages.
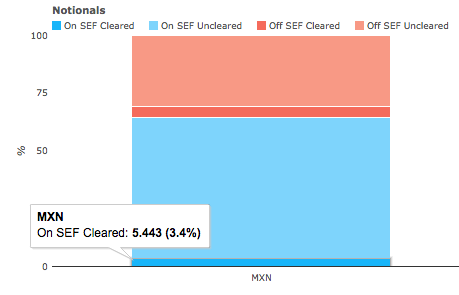
Which show for the month of September, by gross notional:
- $5.4b or 3% is On SEF Cleared
- $98b or 61% is On SEF Uncleared
- $7.4b or 5% is Off SEF Cleared
- $49b or 31% is Off SEF UnCleared
Meaning that 64% is On SEF, most of which is Uncleared and only 8% of total gross notional is Cleared.
Cleared Volumes
Using SDRView Res we can filter on just cleared.
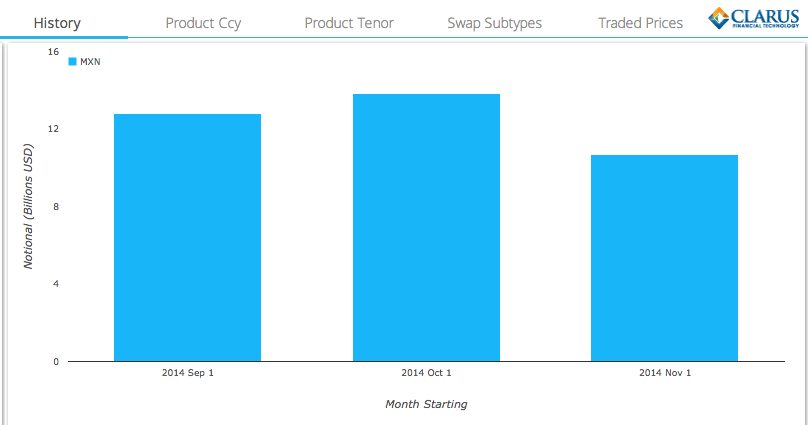
Which shows:
- $12.8b gross notional in Sep
- $13.8b gross notional in Oct
- $10.7b gross notional Nov 1-21
And using our new CCPView app, we can now corroborate these SDR figures with volumes published by Clearing Houses themselves.
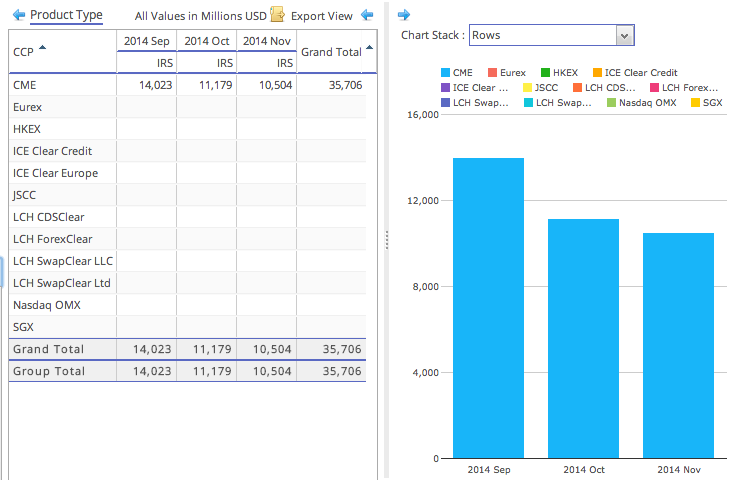
Which shows that:
- All the MXN IRS volume is cleared at CME
- $14b in Sep, $11b in Oct and $10.5b Nov 1-21
- Compare to SDR figs of $12.8b, $13.8b, $10.7b
- So a good but not perfect comparison
The Sep difference can be explained by the large block trades in SDR that have capped notionals, but October would require us to drill-down to the daily volumes from the two sources. I will leave that to do those of you who are interested to do yourself.
SEF Market Share
Using SEFView we can see for the same period where MXN trading is happening:
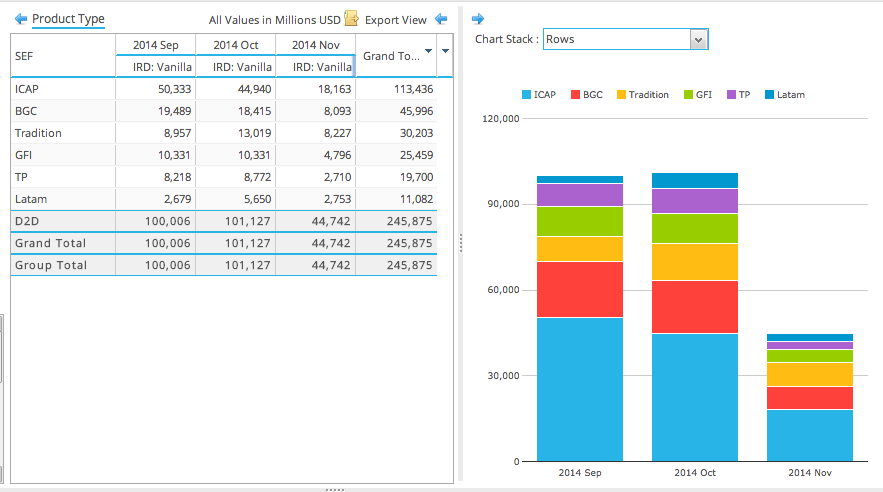
Which shows:
- ICAP way in front with $113b
- BGC next with $46b
- Tradition at $30b, GFI $25b and TP at $20b
- Latam, the only non-IDB SEF, with $11b
- These six SEF have all the volume in MXN IRS
Summary
One year on from my first article on MXN IRS, we look at what the data shows.
Volumes are 50% over the 3-month period from Sep to Nov 2014 than a year earlier.
With $32 billion a week of $6.5 billion a day reported to US SDRs.
Cleared volume is 8% of gross notional and this is all cleared at CME.
On SEF volume is 64% of gross notional.
ICAP is the leader with 46% share.
A total of 6 SEFs (the IDBs plus Latam) show volume.
So while the On SEF percentage compares well with other currencies, the cleared percentage is very low.
That is it for today.
As this is probably my final blog of 2014, I would like to end by wishing you a Happy New Year.