Interest Rate trading volumes are going up and up – October 14th last week saw nearly 2.5 times the Average Daily Volume trading when compared to the past year. As volumes move higher, it is important to appreciate where those volumes are coming from and what it means for your business. As a result, we are seeing clients more and more interested in market share metrics – how is my dealer performing versus the market, which SEF rulebooks should we be reviewing, is my business a meaningful percentage of the market?
Of course, with the various resources we have available, we can cut and slice market share metrics a multitude of ways. If we start with the most simple, using the Clarus API we can pull into Excel the total volume traded by tenor for any index using one simple call. This will give you:
- Cumulative volume
- Number of trades
- Average size
- Prices – average, high, low and last.
For example, for all USD swaps versus 3m Libor on October 3rd, we saw an overall market of: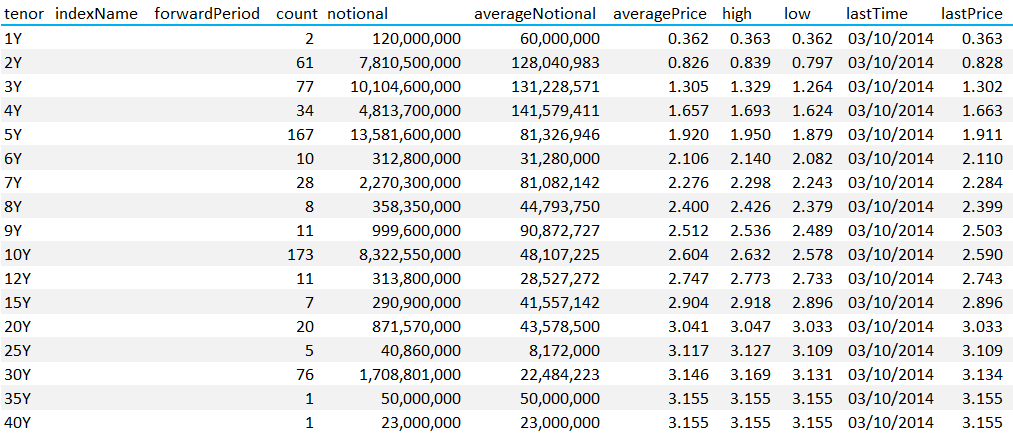
For anyone active in the markets, it is a simple case of stacking up your notional traded by maturity to see what kind of percentage of the overall market you are trading. Whilst in futures space this would typically be a futile proposition, in swaps land we can see as few as 5 trades even in relatively liquid tenors such as 25 years. You may be surprised how meaningful your trades really are!
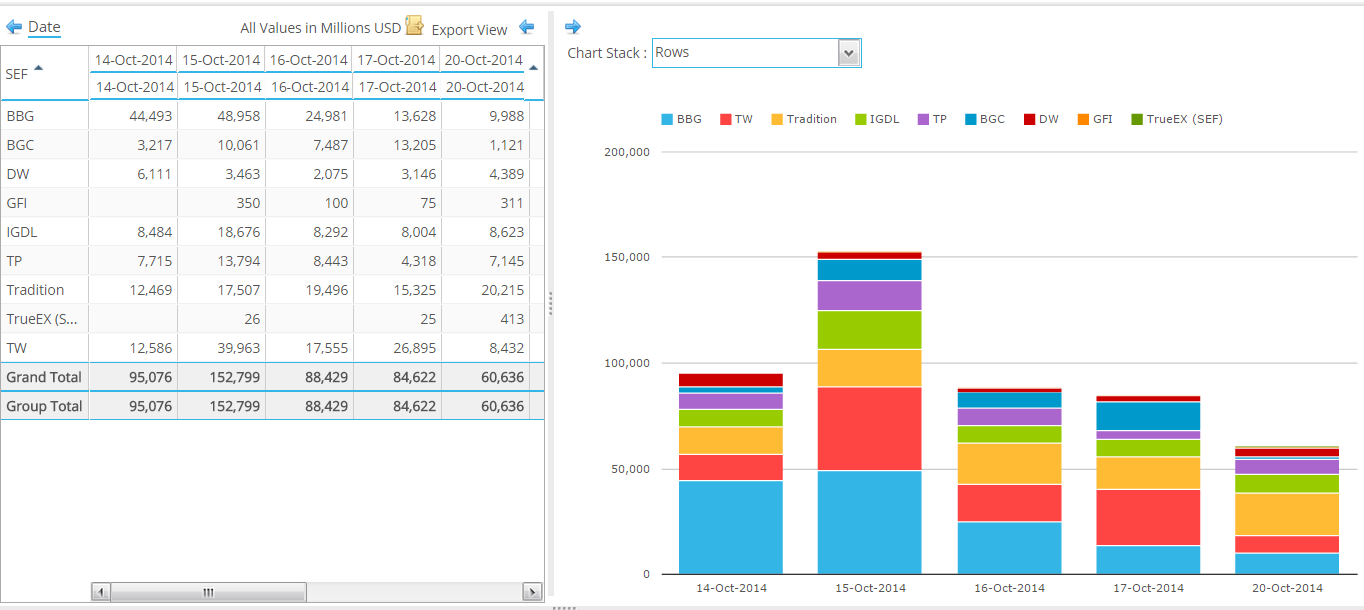
On the other hand, we can drill down readily on the SEF front. Using a new screen in SEFView, we know what the market share by SEFs looks like:
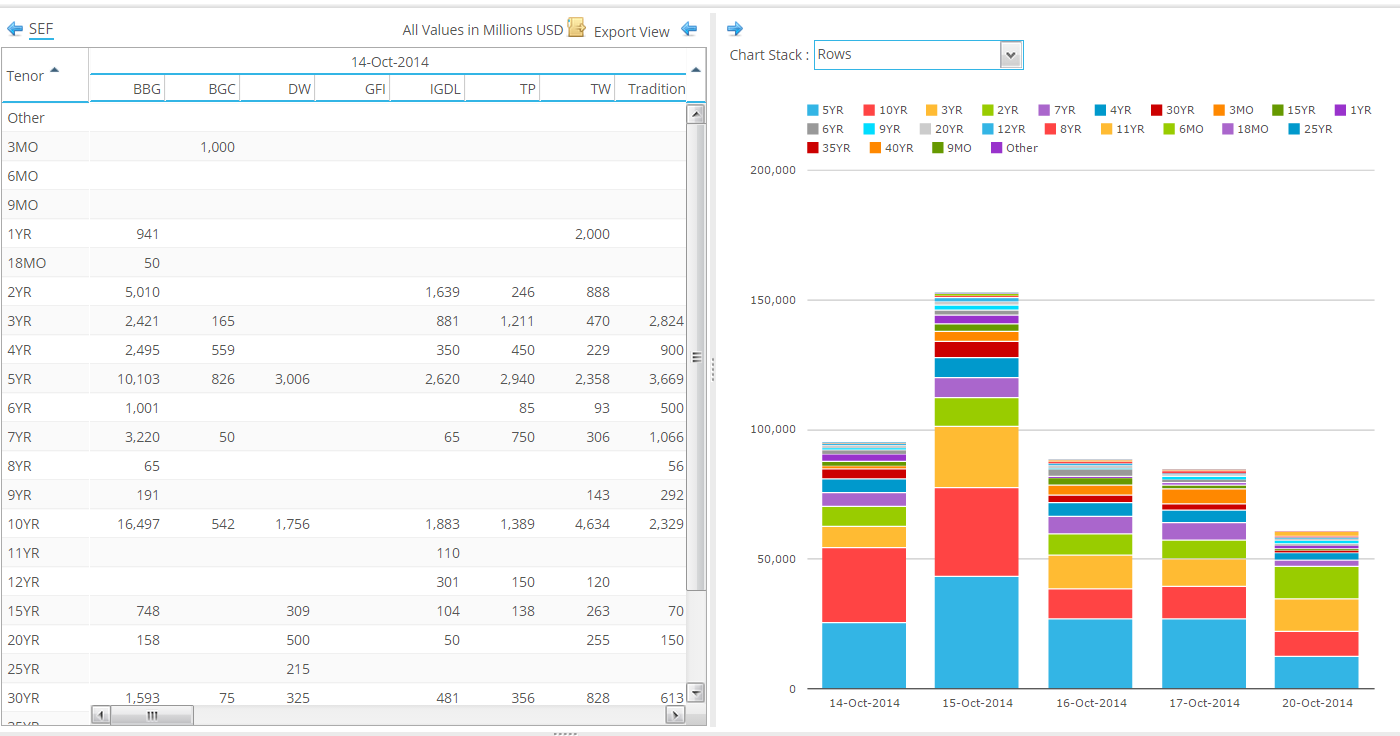
We have also introduced a new cut of this data, such that our clients can view this by Tenor. For example, a market-maker can combine the below with their own trade records and now calculate what their market-share of 5y USD Swaps traded on BSEF is:
 If we want to drill down even further, we can look at trade-level detail. Armed with the public dissemination IDs of their own trades, Clarus clients can therefore calculate their market share metrics by product, currency, tenor and/or execution venue. And further represent those figures on a trade count, trade notional or DV01 basis. For example, you can see a dashboard for these metrics below:
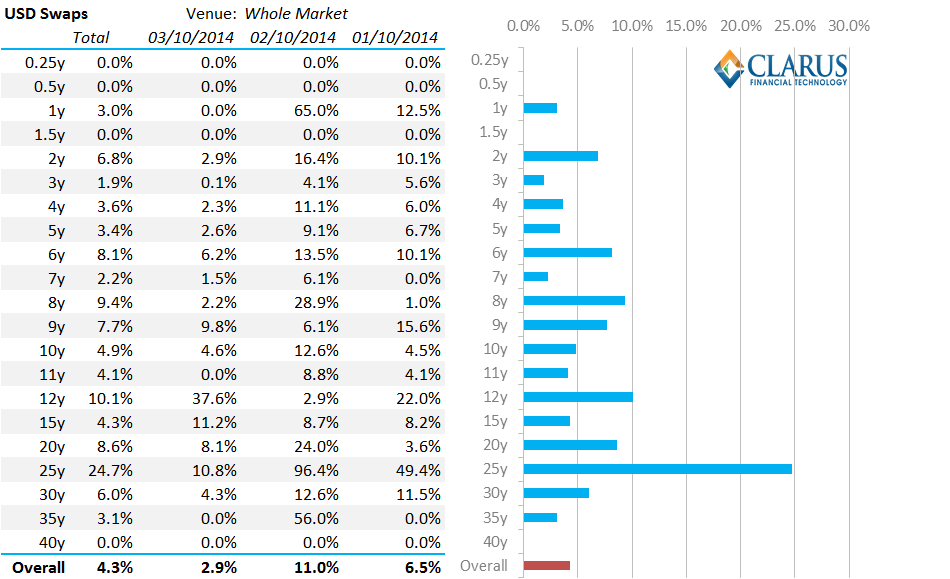
The above shows market share for all USD Swaps across a number of maturities traded across all platforms. We can of course drill-down into venue specific market share using the previous SEFView data.
It looks to me like we are in a world where the above scorecards are going to become more and more important in managing client relationships, market positioning, dealer performance and, no doubt, trader performance. So much for being ranked as a top three dealer, or for clients filling in surveys. We will operate in a world where dealers will score clients, clients will score SEFs, SEFs will score dealers and traders will be scored by everyone!
Put simply, if you know what you traded, then Clarus data will do the rest.
Hi Chris,
Thanks for this.
It would perhaps be useful if you could to see a break down by asset class of the market share as e.g. BBG’s volume is dominated by Credit and in Rates it’s share is on a par with TW?
Best
Jon
Hi Jon – thanks for the comment. We can certainly look at market share in a very granular manner, so separating out Rates, Credit and FX would be pretty easy. We’ve not actually written about market share across different asset classes for a while, so look out for a new blog soon!