Following on from my blog post of Week One, I wanted to provide an update after Week Two and also ask the question whether the Cleared trade activity is going to CME or LCH?
Lets start with a few charts.
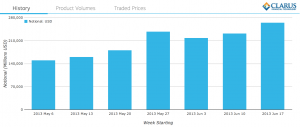
Cleared USD Swap Weekly Notionals from May 6 to June 21. (Click to Enlarge)
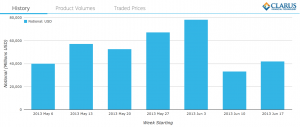
Uncleared USD Swap Weekly Notionals from May 6 to June 21. (Click to Enlarge)
 .
.
So the trend we noted after Week One remains strong, Cleared Volumes are Up and UnCleared Down.
We can also make the following observations:
- Week Two, saw a higher level of trading activity then Week One, with both Cleared and Uncleared higher.
- In-fact June 20, saw the highest single-day gross notional of Cleared USD Swaps traded.
- This was $72.8 billion, of which $43.8b represented capped notional trades and $29b the remainder.
- So the actual gross notional of new traded on June 20 could easily have been higher than $100 billion.
Now for the second part of my article.
We know that Cleared Volumes are up, but can we tell whether this increase in volume is going to CME or LCH?
Well unfortunately the DTCC DDR publicly disseminated data we show in SDR View does not allow us to distinguish where the trades are cleared.
So we need to turn to the websites of CME and LCH and do some detective work.
Now SDR View represents trades reported only by US firms required to under Dodd-Frank, LCH Volumes are global and not restricted to US firms and CME volumes are whatever is cleared by them, though we would expect these to be largely US firms required to report.
So it is not possible to get a straightforward answer to our question.
We could opt for the “rising tides lifts all boats” and say that both CME and LCH are seeing increasing volumes, which is evident by looking at the daily and monthly figures on their websites.
But lets try and make an educated guess.
First lets make our assumptions
CME volumes in USD IRS Swaps are largely done by the same firms required to report under DFA and so these trades are in DTCC DDR and SDR View. And that CME volumes are largely Client activity and not Dealer-to-Dealer.
Second lets get our data.
For each business day from Jun 17 to Jun 21, I made a note of the CME USD IRS Volume figures as $20b, $16.2b, $23b, $41,2b, $58.5b, so a grand total for the week of $159b.
I did the same for LCH USD IRS, with volumes for Client Clearing and for All Clearing. For Client Clearing these are $46b, $75b, $108b, $82b, $47b and for All Clearing $214b, $339b, $455b, $448b, $367b, which as weekly grand totals are $358b and $1,823b respectively.
Then from SDR View, I obtained a total for the week of June 17-21, of $265b or which capped notional trades represented $166b and non-capped $99b. So that $166b notional represents actual notional that is far higher, say in the range of 50% to 100%, which would mean that our total of $265b would be $350b to $431b.
Third lets makes some observations.
- LCH has the lions share of Clearing for USD Swaps trading.
- For the week of June 17-21, LCH did $1,823b, while CME did $159b. So 92% vs 8%.
- For Client clearing, the LCH lions share reduces to a large majority share.
- So if CME volume of $159b is all Client, then LCH Client Clearing is $358b. So LCH 69% vs CME 31%.
- For US Client Clearing, the LCH majority share reduces further, but with the figures at our disposal we are not able to say by how much.
- The SDR volumes of $350b to $431b represent both dealer and client activity for the US and so may only be compared to the LCH Global All Clearing number of $1,823b. This makes US activity between 18% to 25% of the global USD Swap activity, lower than what we would have expected (30% to 50%), so it may be that our assumption of 50% to 100% capped notional uplift is too low and needs to be revised upwards.
- Both CME and LCH figures are showing significant daily increases over the period June 7 to June 24.
- So CME reported daily figures hovering around $20b in the period June 7 to June 19, but these have jumped to $41b, $58b and $61b on June 20, 21 and 24 respectively. The last two days being the first time in this period that they have exceeded LCH Client figures.
- LCH daily Client Clearing figures in the period June 7 to June 24, started at a low of $43b on June 7, rose to $91b on June 12 and then hit a new high of $108b on June 19, ending on $47b and $55b for June 21 and 24.
So we are not able to fully answer our question.
As always, I leave you with the message that we need to keep watching the data.
Just this time with the corollary that there is more data to check than that in SDR View.
A rising tide lifts all boats.
2 thoughts on “Mandatory Clearing, June 10, Week Two and CME or LCH?”
Comments are closed.