The Real Time SDRView aggregates all reported SDR trades of the chosen product, index, and currency. There are four panels:
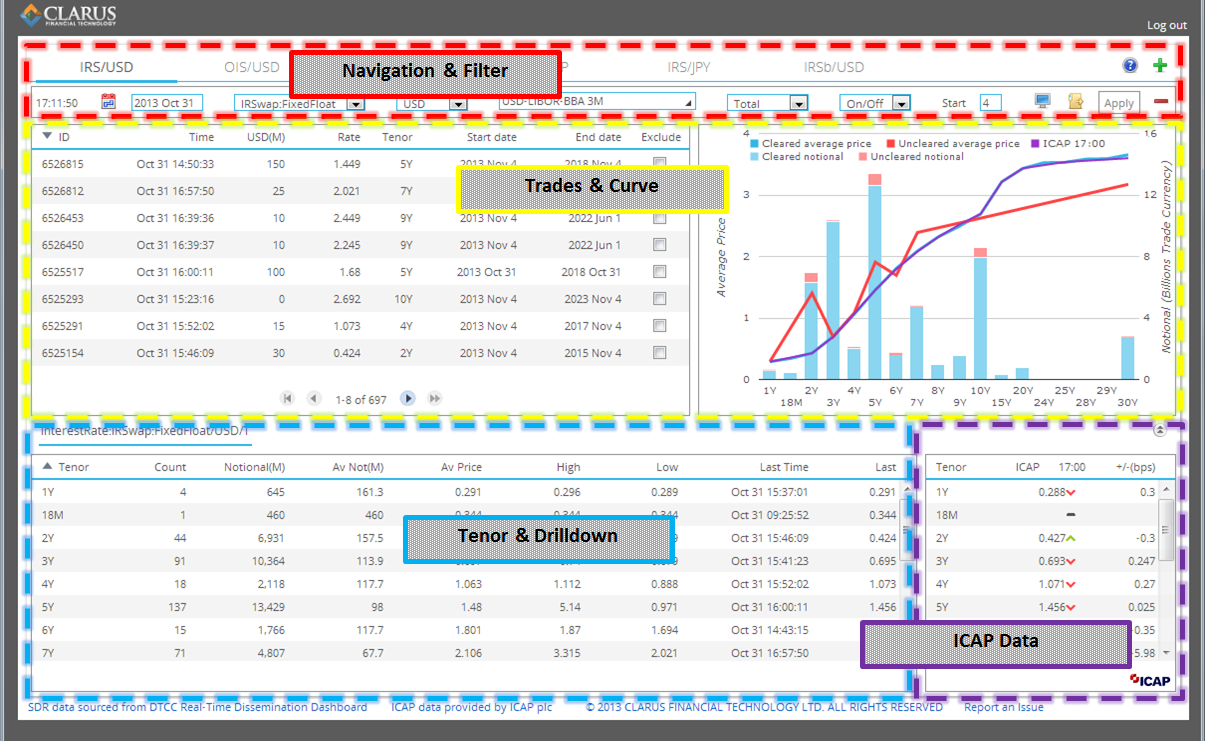
Navigation & Filter
The filter panel drives what data is shown and charted on the SDRView tool.
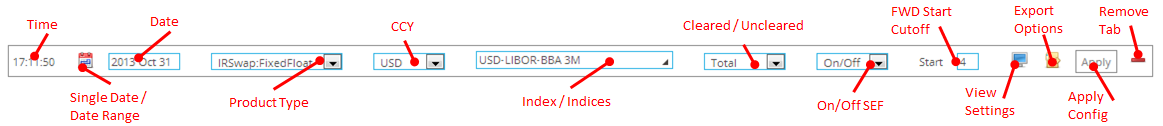
Use these filters for reporting date, product, index, clearing status, and ON/OFF facility (on/off SEF) to refine the data shown. Clicking on the Calendar icon  allows you to choose trades for a range of dates. This helps when looking at some less active product types such as cross ccy swaps. You will see two dates, and it will default to a 1 week range.
![]()
Clicking the View Options  allows for finer changes:

- Reporting Ccy: By default, trade currency is used for reporting, but can be changed to USD or EUR.
- Plot Counts: By default, notional amounts are used, but can be changed to trade counts.
- Notional Weighted: By default, pure average prices are used, but can be changed to notional-weighted average prices.
- Separate Capped: Provides separate columns on the trade drilldown for statistics, based on capped and un-capped trades.
Finally, you are encouraged to save your frequent reports as pre-defined navigation pages for ease of retrieving at a later time. In the example below, the user has saved 5 frequent analysis. To add a new tab/page, click the  sign.
sign.

Trades & Curve
All transactions for the reporting date arrive in the left-hand side of this panel (shown below), and are updated in real time as reported by the SDRs. All data can be sorted by clicking the column header, so that, for example, the largest notional, or the most recent trades can be seen at the top. Multiple pages of trades can be navigated using the page changer ![]() . Note that the total number of trades listed here are inclusive of Cancel trades (Action of “C”) and correction / replacement trades (Action of “R”). Hence a trade that has been submitted, cancelled, and replaced today will have 3 rows. You can read more about investigating these in the Trade Ticket window, further below.
. Note that the total number of trades listed here are inclusive of Cancel trades (Action of “C”) and correction / replacement trades (Action of “R”). Hence a trade that has been submitted, cancelled, and replaced today will have 3 rows. You can read more about investigating these in the Trade Ticket window, further below.
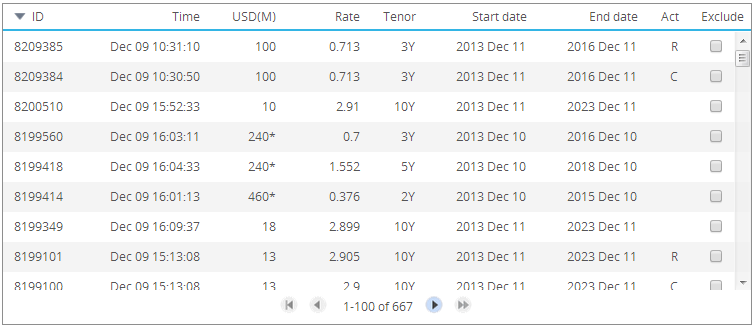
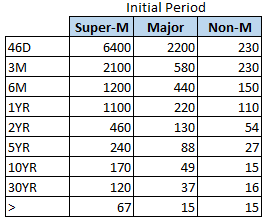
Note that at any time you see a notional with an asterisk, this denotes a capped notional trade. A capped notional is an attribute of a block trade, however only block trades above prescribed thresholds will have capped notional amounts. The debate about capped notional trades can be found by following Clarus FT blogs, for example here. As a general guideline, the capped trades will follow the following table up through at least April 2014, when the CFTC will use a “75% rule” to establish cap sizes, and update these cap sizes on an annual basis. This information should not be construed as official, so please consult the CFTC website for final rules and implementation:
The chart on the right of the panel demonstrates two things – (1) the total notional amount (or trade count) per tenor and (2) a curve based on average prices. By default, all trades are included in the chart and curve. You can remove any trades from the chart by clicking on the “Exclude” checkbox  in the trade panel. This can be useful for off-market data that may be due to backloaded trades or components of a structure, to name a few.
Note the configurations that can modify the chart:
- Excluding trades in the trade panel removes them from the analysis
- By default, notional amounts are used, but can be changed to trade counts
- By default, pure average prices are used, but can be changed to notional-weighted average prices
- By default, trade currency is used for reporting, but can be changed to USD or EUR.
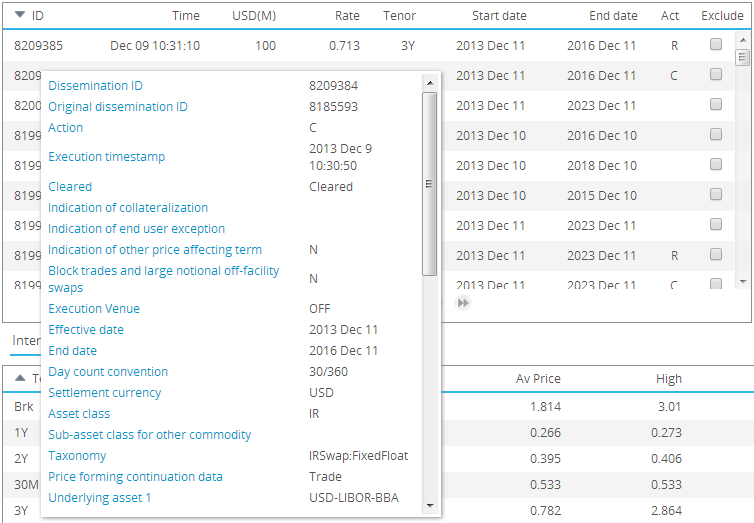
For a full trade ticket for any trade in this list, click on the trade “ID”. This shows all reported fields, including details of the original ID for cancellations and correct/replacements:
Tenor & Drilldown
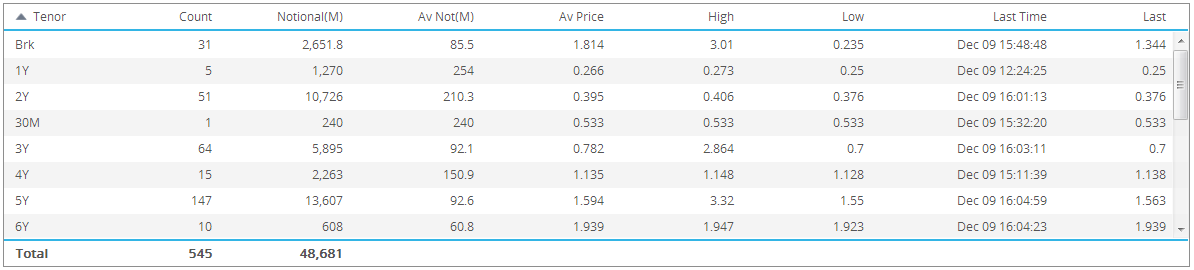
In the default Tenor View, all transactions for the reporting date are bucketed by tenor, with headline statistics for number of trades, notional, and prices. Data in this table can be sorted by clicking on the column header.
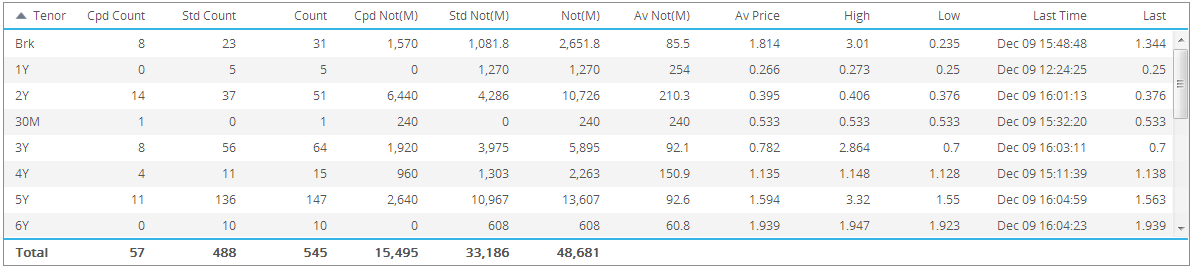
One of the view options in the “Navigation & Filter” panel allows for the clear separation of capped and uncapped trades:
Note that the totals in the tenor view are exclusive of cancelled trades.
Clicking on any of the statistics in the tenor view performs a drilldown to the underlying transactions. Below, we have clicked on the 54 trades in the 5Y bucket. The data contained here is fairly self-explanatory. The “C/U” column denotes whether the trade is cleared or uncleared, and once again any capped notionals are flagged with an asterisk. Note that all reported data is shown here. For full details on trade data requirements, you can consult the Part 43 final rules document on the CFTC website here. Appendix A details the data, starting on page 222.
The tenor view contains a row labelled “BRK”. This row includes any swaps executed today, within the fwd start window, that are non-standard tenors. The drilldown for these show the precise start and end dates for these swaps (as with any drilldown). These broken dated swaps are included for completeness.
ICAP Data
The levels presented as ICAP Data in SDRView Professional are compiled and distributed by ICAP Information Services (IIS). They represent an indicative mid price of market observations from our brokerage operations around the globe. IIS aggregates these price observations, calculates a mid between the bid/ask sides and snaps a curve once each hour.
SDRView Professional presents these hourly, indicative ICAP market curves as a reference barometer of where trading is likely to be taking place for each respective product, index and currency. The juxtaposition with the SDR last reported trade for each tenor can provide rich, independent insight as to the relative correlation of pre-trade price discovery and post-trade regulatory transparency
ICAP Data is portrayed in 2 panels of SDRView Professional:
- Graphically, in the Trades & Curve panel, as the purple line graph overlaying the SDRView average price for each tenor, and;
- As a table, in the ICAP Data panel
- Both the graphic curve and the table are updated once during each trading hour of the day. The update time stamp is displayed in both panels as a reference.
The ICAP Data panel has a column for each tenor along with the 1) latest price level, 2) a momentum indicator since last update (up/down/flat) and 3) basis point (bp) difference between the ICAP Data and the SDR-reported, last trade.
For further information from ICAP – please contact icapinformationservices@icap.
ICAP data is only available when licensed as an additional service to SDRView.
Feedback
We are continually enhancing and refining our product. Please reach out to us by phone, or email us at [email protected].