- SOFR Swaps at D2D Venues trade as Spreadovers, Butterflys or Curve trades
- In 2023 more than 30,000 Spreadovers with > $1.5b DV01 traded on D2D venues
- In Spreadovers, ICAP has 47% share and BGC 22%
- In Butterflys, 11,250 trades, Tradition with 40% share
- In Curves, 5,300 trades, ICAP 39% share
- In CCPSwitch, 473 trades, Tradition 45% share
- On D2C Venues, Outrights are the most common trade
- In 2023, close to 100,000 Outrights with > $2.3b DV01 traded
- In Outrights, Tradeweb is 67% and Bloomberg 33% (in DV01 terms)
- In Curves, 17,050 trades, Bloomberg 56%, Tradeweb 44%
- In Butterfly, 5,000 trades, Tradeweb 52%, Bloomberg 48%
- Forwards/IMM/MAC Swaps also trade in significant numbers on D2C Venues
- IMMs with 31,000 trades and Forwards with 23,000 trades
- Continue reading for the charts, tables and details
Background
In May 2023, I published a blog on IDB Market Share in SOFR Swaps, which used data we collect, filter and enhance in pur SDRView product. The blog looked at the type of SOFR Swaps that trade on Inter-Dealer Broker (IDB) SEF venues, also referred to as Dealer-to-Dealer (D2D venues); namely Spreadovers, Curves and Flys and showed the 2023 monthly volumes up to April 2023.
In today’s blog, I will extend that analysis to the whole of 2023 and also to Dealer-to-Client (D2C) venues.
Let’s get started.
D2D SEF Volumes in SOFR Swaps
First using SDRView we show a chart and table of trade counts for the year 2023, for spot starting USD SOFR Swaps that are On SEF and the SEFs are D2D. The table columns are the Platform Id of the SEF and table rows are package types (as identified by Clarus).
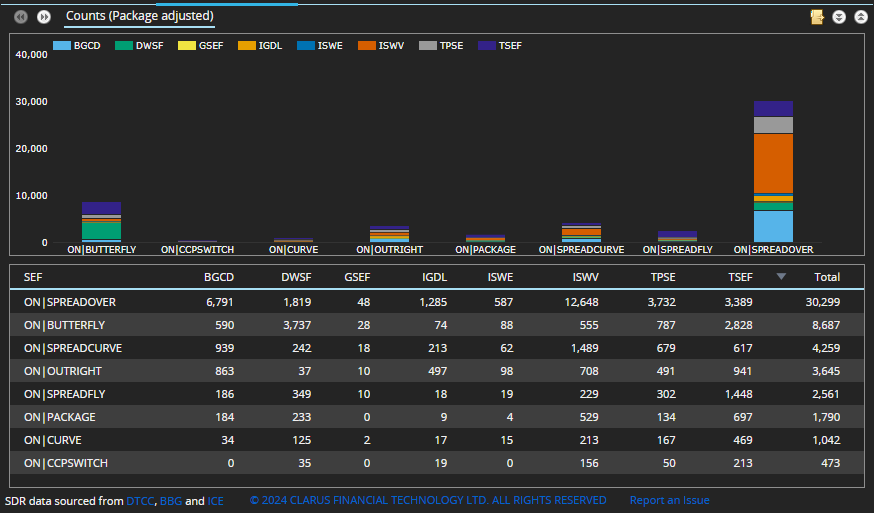
- Spreadovers are by far the most common type with 30,299 trades in the year.
- The ICAP venues (IGDL, ISWE, ISWV) with 14,520 trades represent 47.9% share
- BGC with BGCD and GSEF(should this be D2C?) with 6,839 trades represents 22.6% share
- Tullet (TPSE) is 12.3%, Tradition (TSEF) 11.2% and Dealerweb (DWSF) is 6%
- Butterflys, shown above as Butterfly or SpreadFly aggregate to 11,248 trades in the 2023
- (Note this is a package adjusted count, so as there are 3 trade legs for each butterfly in SDR data, a total of 33,744, we adjust this to the 11,248 butterfly packages traded)
- Tradition with 4,276 trades represents 38% share
- Dealerweb with 4,086 trades, mostly from Sweep, it’s session based trading platform, represents 36%
- Curve Switches, shown above as SpreadCurve and Curve combine to 5,301 trades
- (Note this is also package adjusted, so 2 trade legs and 10,602 transactions in SDR data)
- ICAP with 2,009 represents 37.9% share
- Tradition 20.5%, BGC 18.7%, Tullet 16%, Dealerweb 6.9%
- CCPSwitch, with 473 trades
- Tradition with 213 or 45%
- ICAP with 175 or 37%
The Outright and Packages rows above represent noise in the data and I will ignore for our analysis. The former are most likely Spreadovers that we have not identified, while the later should be one of the other types or a granular type we do not identify. Including or excluding these does not make a material difference to our analysis above.
Next, instead of trade count, we can change the above table to show DV01 (package adjusted).
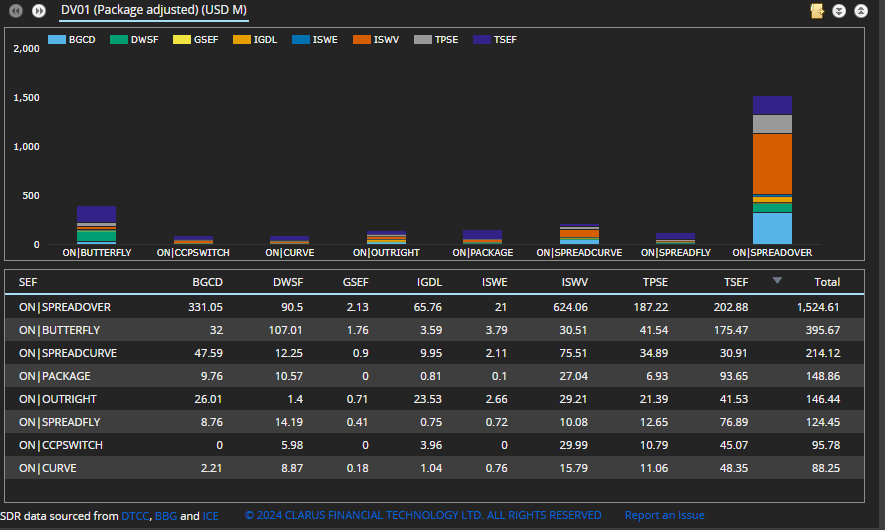
- Spreadovers with > $1.5 billion of DV01 in 2023
- (recall that SDR capped notional rules, means this figure is under-stated, possibly by up to 30%)
- Re-calculating the shares above in DV01 terms shows some differences from trade counts shares
- Spreadovers, ICAP with 46.6%, BGC 21.9%
- Butterflys, Tradition with 40%, Dealerweb 20%, ICAP 17.2%
- Curves, ICAP 39.2%, Tradition 24.5%
- CCPSwitch, Tradition 54.8%, ICAP 19.9%
DV01 has the advantage as its is a better proxy to the brokerage revenue earned and share of wallet.
D2C SEF Volumes in SOFR Swaps
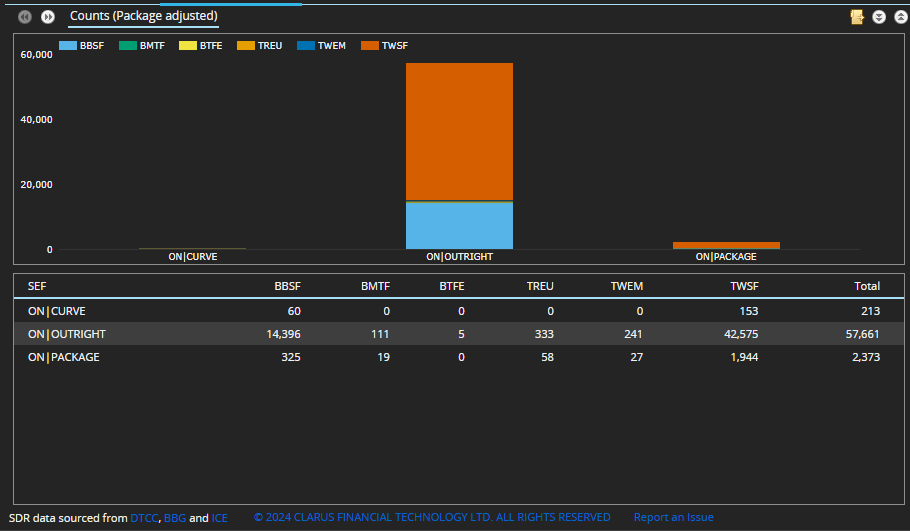
Next using SDRView we show a chart and table of trade counts for the year 2023, for USD SOFR Swaps (spot starting) that are On SEF, the SEFs are D2C with columns as Platform Id of the SEF and rows as package types (as identified by Clarus).
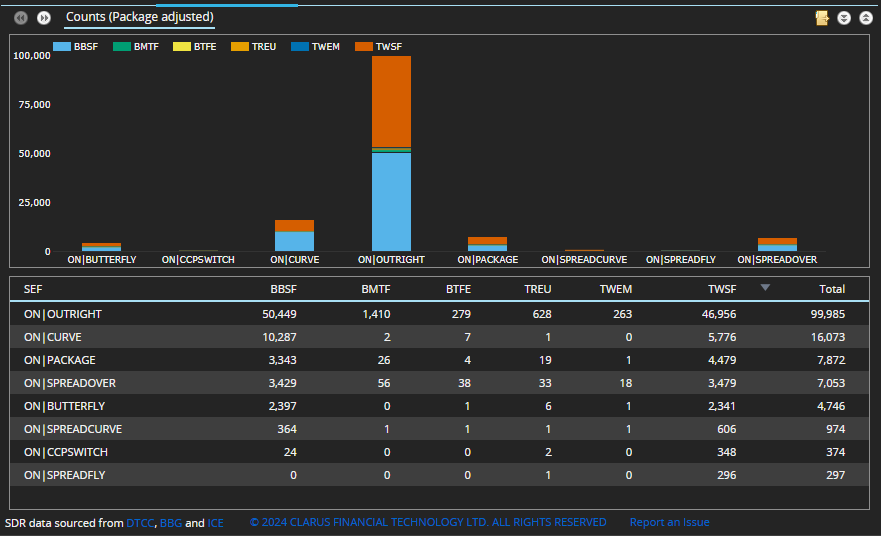
- Outrights are by far the most common trade type with 99,985 trades
- Compare this to the 30,300 Spreadovers on D2D SEFs
- Bloomberg venues (BBSF, BMTF, BTFE) with 52,138 trades have 52% share
- Tradeweb venues (TREU, TWEM, TWSF) with 47,847 trades have 48% share
- Curve, shown above as Curve or SpreadCurve with 17,047 trades (package adjusted)
- Compare this to the 5,300 in D2D SEFs
- Bloomberg with 10,662 or 62.5% share
- Tradeweb with 6,385 or 37.5%
- Spreadovers with 7,053 trades (compared to 30,300 on D2D)
- Split 50-50 between Bloomberg and Tradeweb
- Butterflys with 5,043 trades (compared to 11,248 on D2D)
- Tradeweb with 52.4% and Bloomberg with 47.6%
Package with 7,872 trades, is a higher number than we would like and a future task to further categorise and break this down into a more granular type.
Next, as before lets change the above table to show DV01 (package adjusted).
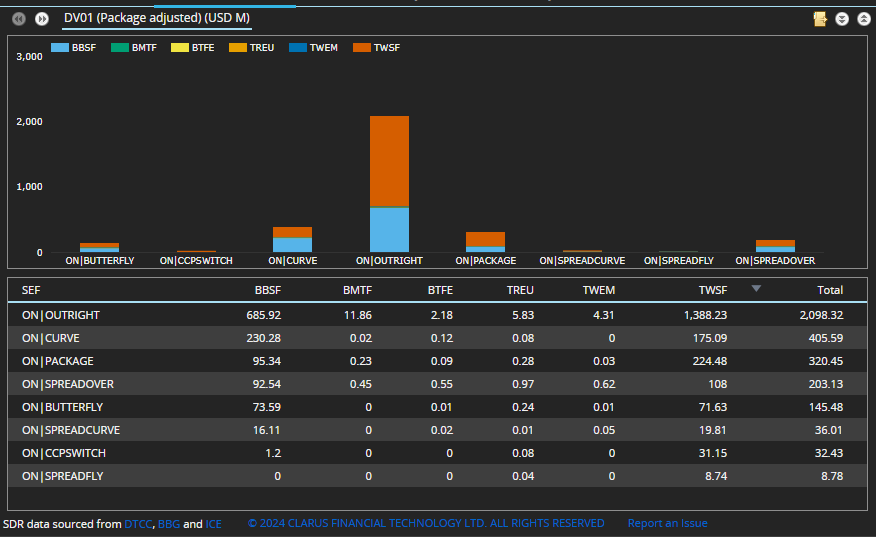
- Outrights and Spreadovers with > $2.3 billion of gross dv01
- So higher than the > $1.5 billion DV01 on D2D SEFs
- Re-calculating the shares in DV01 terms shows material differences
- Outrights has Tradeweb 66.6% and Bloomberg 33.4%
- Curve is Bloomberg 55.8% and Tradeweb 44.2%
- Spreadover is Tradeweb 54%, Bloomberg 46%
- Butterfly is Tradeweb 52.3%, Bloomberg 47.7%
Next Forwards, IMM or MAC Swaps trades in significant volume on D2C venues, unlike on D2D.
More interestingly, we can further split these into Forwards, IMM and MAC rows.
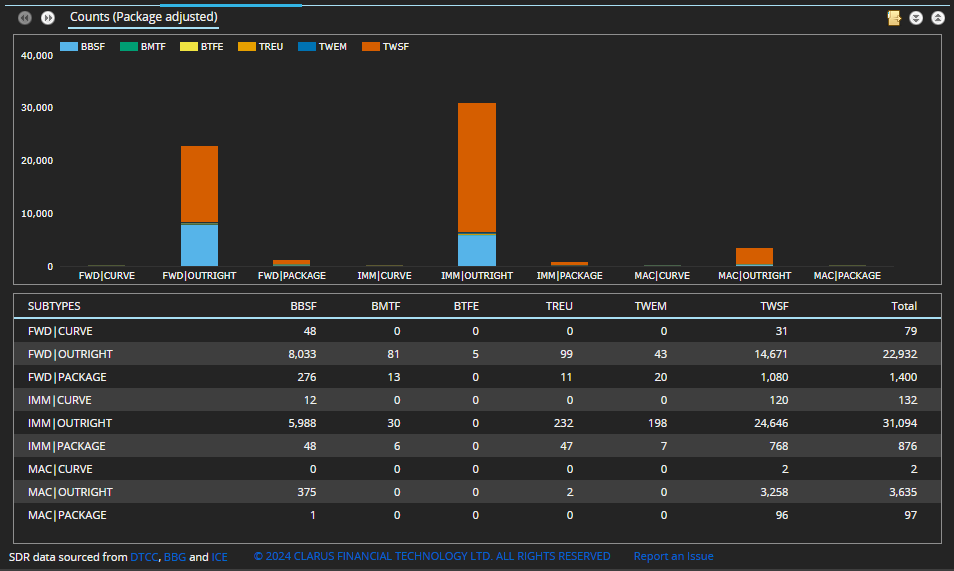
- IMM Outrights the largest type with 31,094 trades
- Forward next with 22,932 trades
- MAC (Market Coupon) with 3,635 trades
- Package here are most likely to be Invoice Spreads (vs CME Futures)
I won’t go into share percentages here, but the data above allows this to be calculated.
Similarily in the interests of brevity, we will skip the DV01 table for the above.
That’s It
Six charts and tables to cover SOFR Swap volumes and share.
There is a lot more data in SDRView and SEFView.
Daily, weekly, monthly, quarterly and annual.
Currency, Product, Subtype and Package type.
Trade counts, notionals, dv01.
Venue type (D2D, D2C, SDP, Off Venue).
Please contact us if you are interested in a subscription.
great analysis, really appreciate the breakdown by trade type. Extremely interesting to see how much competition there is between Bloomberg and Tradeweb in the D2C space.