
This blog reviews Q2 2026 D2D platform market shares of major currency rates swaps risk-trading, continuing the quarterly series from Q1 2026 shares of D2D platform core rates swaps.
Key takeaways
Q2 2026 saw the following D2D platform market share leaders and shifts in each major currency:
- USD SOFR swaps were led by ICAP with a 31.4% share. There was a 5.2% YoY shift from the IDB-originated platforms to the more electronic platforms – Dealerweb and RTX.
- EUR Euribor and €STR swaps were led by Tullett Prebon (Tulletts) with a 50.2% share. The main YoY shift was from Tulletts to BGC.
- AUD BBSW and AONIA swaps were dominated by Tulletts with an 80.2% share. The main YoY shift was from BGC to Tradition (Trads).
- GBP SONIA swaps were led by ICAP with a 57.7% share. The main YoY shift was from Tulletts to the other three firms.
- JPY TONA swaps saw a lead change to Tulletts with a 38.5% share. The main YoY shift was from Trads to Tulletts and BGC.
- CAD CORRA swaps were led by Tulletts with a 69.6% share. The main YoY shift was from Tulletts and Trads to BGC.
All the charts and statistics in this blog were sourced from SDRView.
Background
Here we focus on D2D platforms’ bread-and-butter trading activity in cleared OIS and fixed-float IRS, excluding compressions to keep the focus on risk-trading. This means we exclude activity on D2D platforms in cleared FRAs and inflation swaps and in uncleared swaptions and cross-currency swaps. The excluded activities noted are covered in separate (though less frequent) blogs.
We assess market share based on package-adjusted trade count, a metric which directly counts package execution events and avoids double- or triple-counting of multiple legs in a package. Admittedly the metric ignores trade size variation, but it also avoids the distortion in other volume metrics by the SDR-reporting trade caps.
Volumes by major currency
Note: for readability, we round aggregate package counts to the nearest 100 packages.
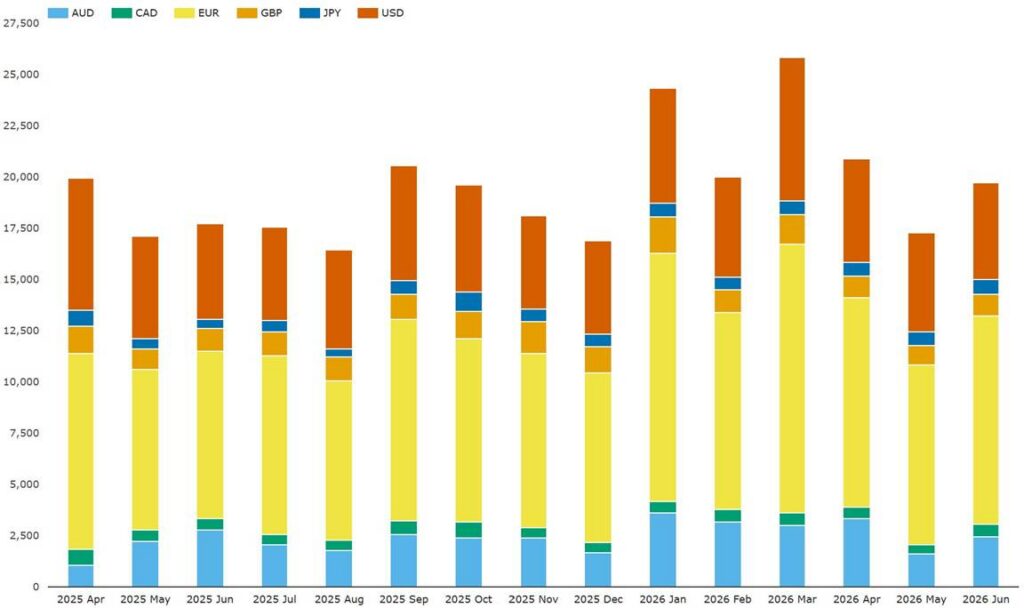
Chart 1: US-reported D2D platform traded cleared OIS and fixed-float IRS (package count). Source: SDRView
Chart 1 shows the month-by-month breakdown of the 57,900 D2D-platform OIS and fixed-float IRS packages executed in Q2 2026 – down 17% QoQ but up 5.7% YoY. Following the record Q1 2026 volumes, Q2 activity was less than 2,200 packages above Q2 2025. Calculating quarter-by-quarter yields Q2 2026 volumes by currency as follows:
- EUR was largest with 29,200 packages (comprising 21,900 Euribor fixed-float IRS packages and 7,300 €STR OIS packages) – down 16% YoY but up 14% QoQ.
- USD was next with 14,600 OIS packages (comprising 14,400 SOFR OIS and 200 FedFunds OIS) – down 16% YoY.
- AUD saw 7,400 packages comprising 7,200 BBSW IRS packages and 200 AONIA OIS packages – down 25% YoY but up 22% QoQ.
- GBP had 3,000 SONIA OIS packages – down 30% YoY.
- JPY showed 2,000 TONA OIS packages – up 5.2% YoY.
- CAD had 1,600 CORRA OIS packages – down 10% YoY.
- All currencies bar JPY declined YoY in D2D platform OIS and / or IRS activity.
SOFR swaps
For clarity, our focus on SOFR swaps means we disregard the 200 or so D2D platform USD OIS packages on the FedFunds index noted above.
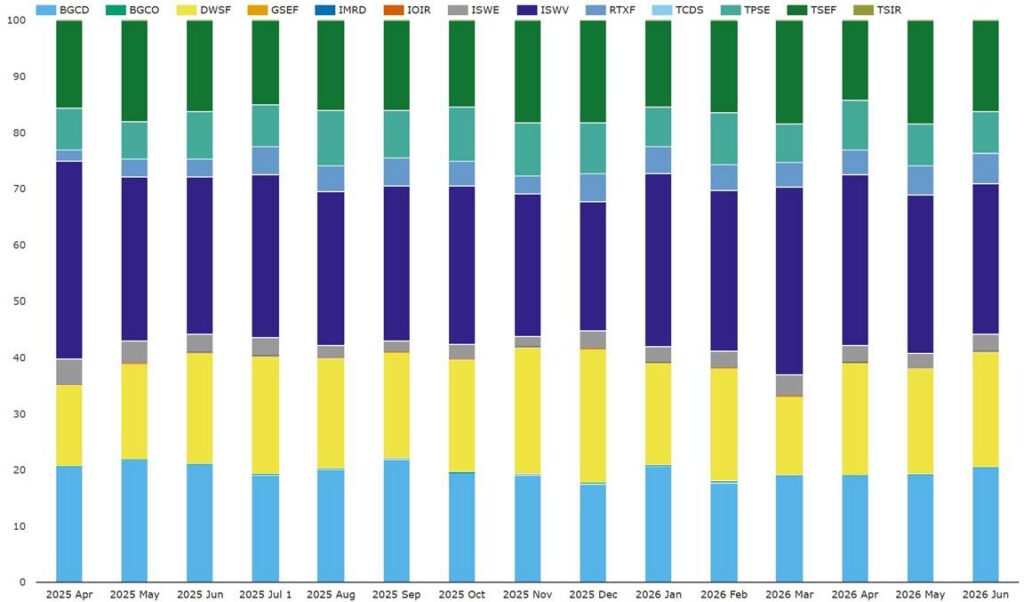
Chart 2: platform shares of US-reported D2D platform traded cleared SOFR swaps (percentage of package count). Source: SDRView
Chart 2 illustrates the month-by-month platform shares of the 14,400 SOFR swap packages executed on D2D platforms in Q2 2026 as noted under Chart 1. Calculating quarter-by-quarter yields Q2 2026 shares as follows:
- ICAP (mainly ISWV and ISWE) led with 31.4% – down 3.8 points YoY.
- Dealerweb (DWSF, with its session-based electronic trading) overtook BGC for second place with 19.73% – up 2.94 points YoY.
- BGC (mainly BGCD) had 19.67% – down 1.5 points YoY but up 0.3 points QoQ.
- Trads (TSEF) had 16.3% – down 0.2 points YoY.
- Tulletts (mainly TPSE) had 7.9% – up 0.4 points YoY.
- RTX (with its more electronic approach request-for-trade model featured in our recent blog) had 5.0% – up 2.25 points YoY.
There was a 5.2% year-on-year (YoY) shift in market share from the IDB-originated platforms to the more electronic platforms – Dealerweb and RTX.
In the following sections, it is evident that Dealerweb nor RTX do not cover non-USD swap trading.
Euribor and €STR swaps
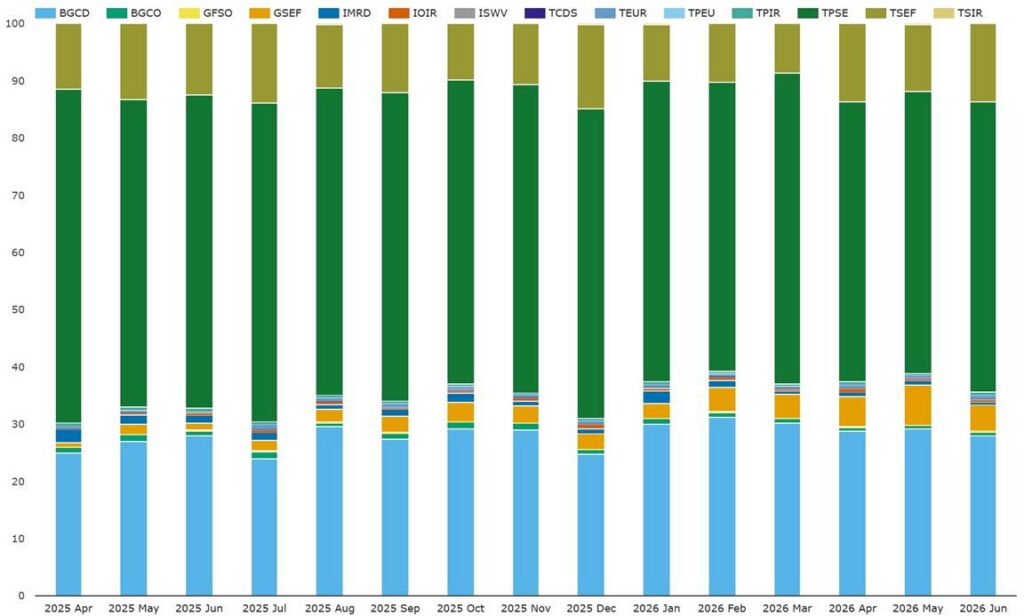
Chart 3: platform shares of US-reported D2D platform traded cleared Euribor and €STR swap (percentage of package count). Source: SDRView
Chart 3 illustrates the month-by-month platform shares of the combined 29,200 Euribor and €STR swap packages executed on D2D platforms in Q2 2026 as noted under Chart 1. Calculating quarter-by-quarter yields Q2 2026 shares as follows:
- Tulletts (mainly TPSE) led with 50.2% – down 6.2 points YoY.
- BGC (mainly BGCD and GSEF) had 34.9% – up 6.1 points YoY but down 0.1 points QoQ.
- Trads (mainly TSEF) had 13.6% – up 1.1 points YoY.
- ICAP (mainly IMRD) had 1.3% – down 1.0 points YoY.
The main YoY shift was from Tulletts to BGC.
BBSW and AONIA swaps
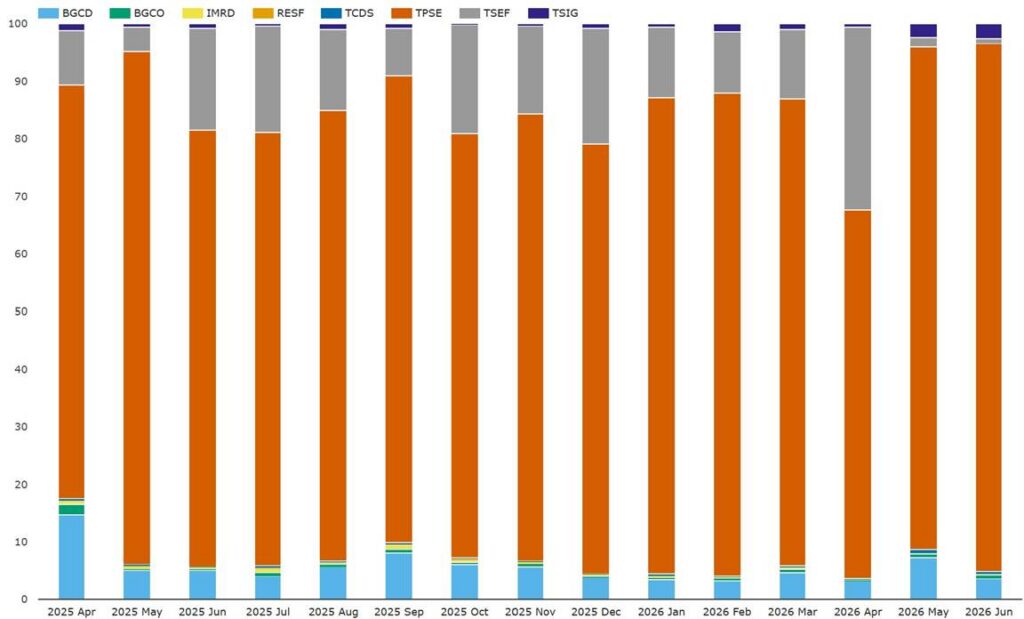
Chart 4: platform shares of US-reported D2D platform traded cleared BBSW and AONIA swaps (percentage of package count). Source: SDRView
Chart 4 illustrates the month-by-month platform shares of the combined 7,400 BBSW and AONIA swap packages executed on D2D platforms in Q2 2026 as noted under Chart 1. Calculating quarter-by-quarter yields Q2 2026 shares as follows:
- Tulletts (mainly TPSE) dominated with 80.2% – down 0.8 points YoY.
- Trads (TSEF) had 15.1% – up 3.7 points YoY.
- BGC (mainly BGCD) had 4.6% – down 2.6 points YoY but up 0.4 points QoQ.
- ICAP (IMRD) had 0.14% – down 0.26 points YoY.
The main YoY shift was from BGC to Trads.
SONIA swaps
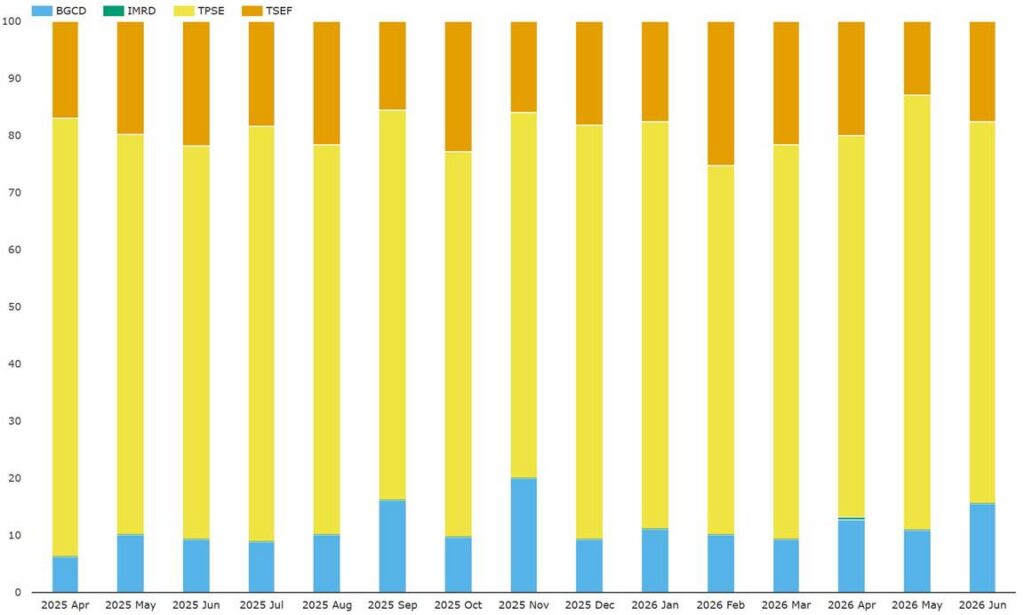
Chart 5: platform shares of US-reported D2D platform traded cleared GBP SONIA swap (percentage of package count). Source: SDRView
Chart 5 illustrates the month-by-month platform shares of the 3,000 SONIA swap packages executed on D2D platforms in Q2 2026 as noted under Chart 1. Calculating quarter-by-quarter yields Q2 2026 shares as follows:
- ICAP (mainly IMRD) led with 57.7% – up 1.7 points YoY.
- BGC (BGCO, BGCD, and GFSO) had 24.0% – up 2.7 points YoY but down 4.0 points QoQ.
- Tulletts (TPSE and TCDS) had 13.6% – down 5.7 points YoY.
- Trads (TSEF) had 4.7% – up 1.3 points YoY.
The main YoY shift was from Tulletts to the other three firms.
TONA swaps
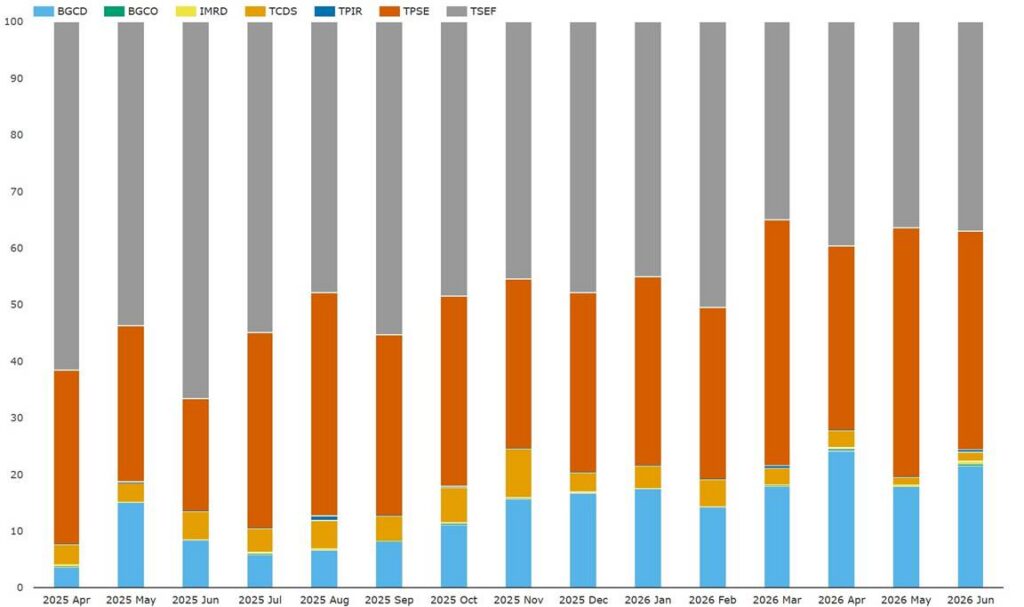
Chart 6: platform shares of US-reported D2D platform traded cleared JPY TONA swap (percentage of package count). Source: SDRView
Chart 6 illustrates the month-by-month platform shares of the 2,000 TONA swap packages executed on D2D platforms in Q2 2026 as noted under Chart 1. Calculating quarter-by-quarter yields Q2 2026 shares as follows:
- Tulletts (mainly from TPSE) took the lead from Trads with 38.5% – up 11.5 points YoY.
- Trads (TSEF) had 37.7% – down 22.9 points YoY.
- BGC (mainly from BGCD) had 21.5% – up 13.1 points YoY.
- ICAP (mainly from IMRD) had 2.4% – down 1.7 points YoY.
The main YoY shift was from Trads to Tulletts and BGC.
CORRA swaps
Chart 7: platform shares of US-reported D2D platform traded cleared CAD CORRA swap (percentage of package count). Source: SDRView
Chart 7 illustrates the month-by-month platform shares of the 1,600 CORRA swap packages executed on D2D platforms in Q2 2026 as noted under Chart 1. Calculating quarter-by-quarter yields Q2 2026 shares as follows:
- Tulletts (TPSE) led with 69.6% – down 2.9 points YoY but up 1.5 points QoQ.
- Trads (TSEF) had 17.0% – down 2.3 points YoY but up 4.7 points QoQ.
- BGC (BGCD) had 13.3% – up 5.0 points YoY.
- ICAP (IMRD) had 0.12% – their first volume since before Q2 2025.
The main YoY shift was from Tulletts and Trads to BGC.
That’s it
We used seven charts and one table to cover D2D platform market shares of major currency rates swaps. Recap the key takeaways by going back to the top.
Watch this space for quarterly coverage of this topic going forward.
Contact us if you are interested in using SDRView.