The CME are due to begin clearing Brazilian Real interest rate swaps by the end of August 2015. I thought it worthwhile to uncover what we can see in the data prior to their launch.
What is a BRL Swap?
BRL swaps have a few peculiarities. Let’s have a brief look at the characteristics:
 Fixed vs Float.
- Payment of both legs is once at maturity (ala zero coupon).
- Payment of both legs is based upon a business day count BUS 252 (accruals only happen on business days, with 252 business days per year).
- Floating index is CDI. CDI is an index determined daily by CETIP as the average of all overnight inter-bank deposits that day.
- The floating payment is then based on the sum of the daily accruals.
- Because BRL is a non-deliverable currency, all of this has to be transferred to USD, which the CME has chosen to convert using Bloomberg Page BZFXPTAX at 6:00 p.m. Sao Paulo time.

The CME info-sheet on this product makes clear that all settlement will happen in USD, and the maximum maturity allowed will be 10 years, presumably that is where liquidity starts to become thin.
I spent a couple years in Sao Paulo one summer (see what I did there) – and I can first hand tell you that valuing CDI swaps is not terribly straightforward, particularly when you try to jam them into a legacy trading system. One of the most difficult concepts was handling on-shore vs off-shore. The problem as it relates to BRL CDI swaps is that BM&F Bovespa have very active contracts in CDI that can be used for building a curve and valuing swaps, that is all good. Only problem is that these contracts represent on-shore (Brazilian) business. Once BRL is transacted off-shore, you get into a world of tax that ends up meaning there are separate off-shore CDI rates; however there exist no true listed instruments from which to build a curve for off-shore CDI. I have to presume CME is somehow gathering this off-shore market data information from market participants for the daily valuation.
The Data
I’ll use SDRView to look at BRL activity. Remember this should account for US-named trading in these products. For example, it will not account for domestic Brazil (on-shore) trading in CDI swaps.
First in terms of trade count, going back to the start of 2014, we can see trading peaked out at 143 trades in one day of November 2014, with the average standing at about 35 trades per day. This particular chart is broken out by “subtype” – showing spot starting BRL swaps accounting for 68% of the activity. (Apologies this is a large chart, you can click on it to enlarge).
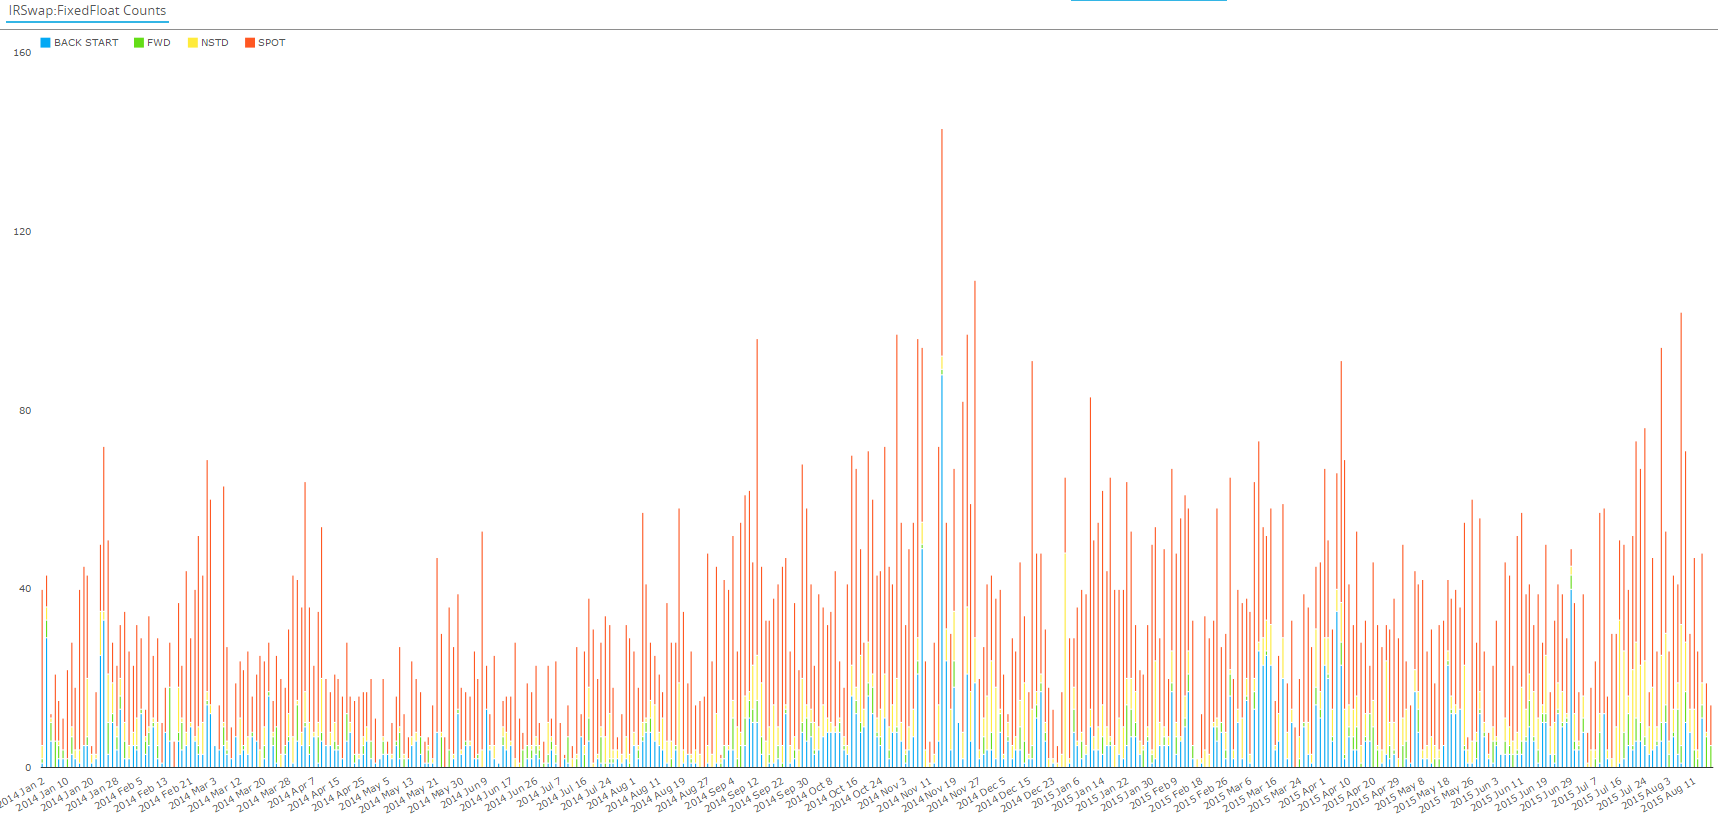
Other notables as I ran this activity through various filters:
- All trades were reported to DTCC (I believe BBG only reports cleared trades to the BSDR).
- 13% of the trades were above the CFTC cap size.
- 90% were flagged as being executed off-SEF.
- Average daily traded amount of 5.8 billion BRL.
- Average number of trades in a day was 35.
- Average trade size over this period is 165mm BRL. Using an USD/BRL FX rate of 3.00, gives us ~55mm USD equivalent trade size. Worth noting however, that the FX rate has fluctuated between 2.25 and 3.50 in this 20 month period!
- A handful of these 14,000+ swaps were flagged as being sent for clearing. I can only presume these were in error, or intended to clear at CETIP or BM&F Bovespa (not sure on their current offerings).
Let’s now look at how BRL activity stands up to other Latin American swaps. I’ve chosen the 6 currencies for which we have seen activity since SDR inception.
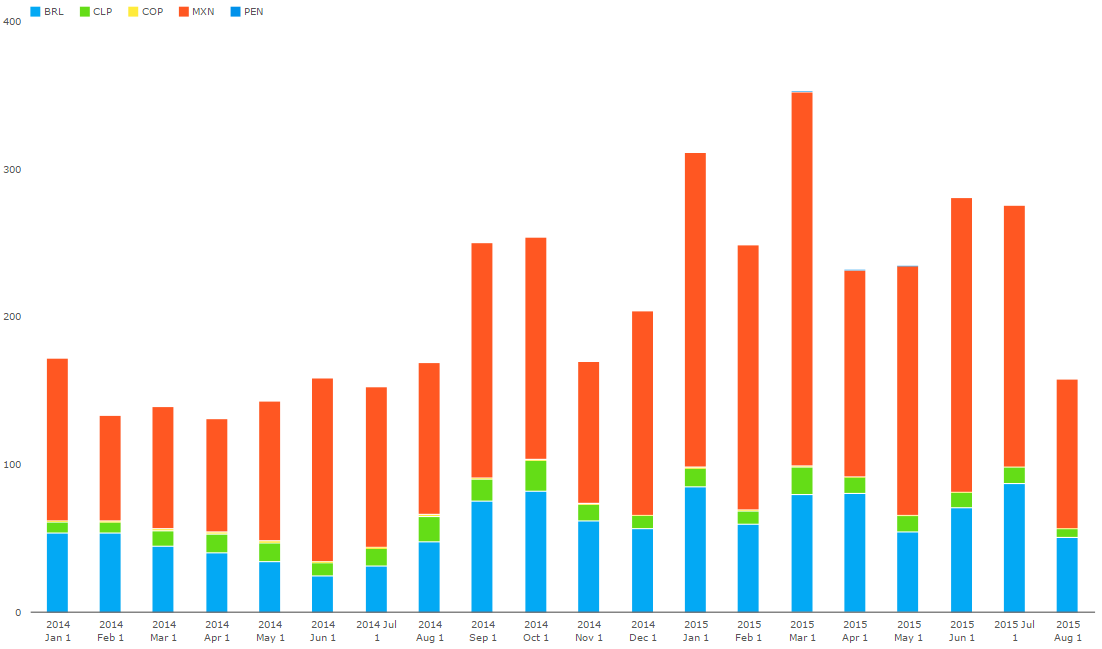
A few things to note:
- Next to MXN (in red, which is cleared at CME now), BRL is the next most significant currency.
- There is insignificant activity in the Peruvian Nueva Sol.
- I also included the Trinidad & Tobago Dollar, but absolutely zero activity.
I suppose it is relevant to look at the adoption of MXN clearing since CME’s launched it in early 2014. A quick look at stacking the MXN activity by clearing status shows us that CME has been successful in garnering nearly half of the MXN market, as of the latest August intra-month data point shows here. I suppose they could hope for an equal performance in BRL CDI swaps:
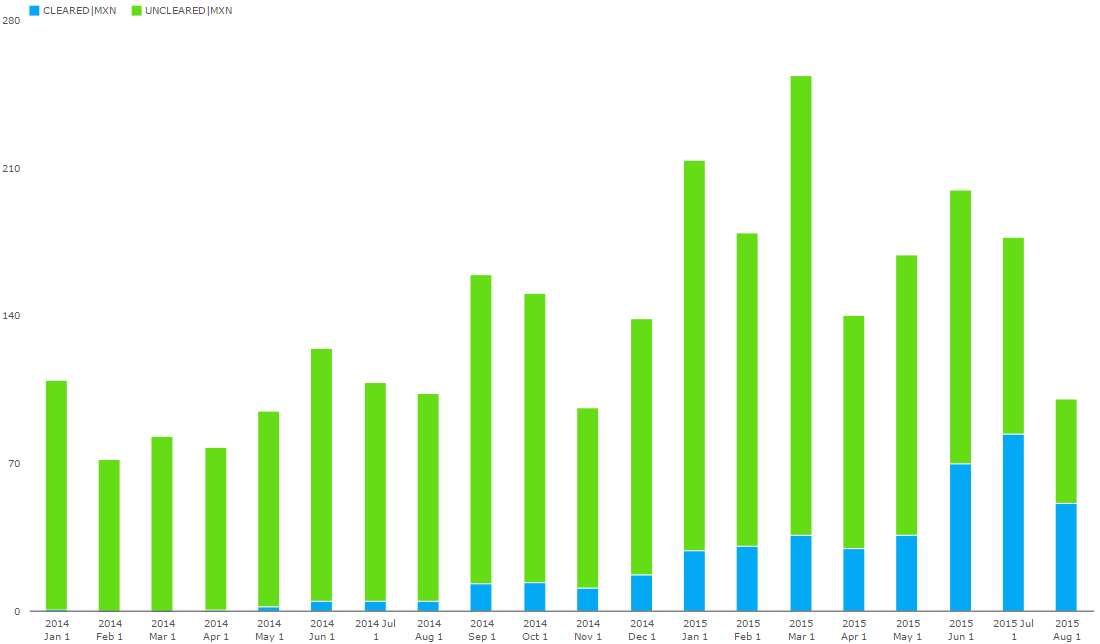
Worth noting here that Mexico is due to begin mandatory clearing for dealers in April 2016, so we might expect to see some further change here, based upon the profile of the firms driving this volume.
Other Data Sets
All of our data is gathered from the Clarus View products, which normalize and enrich data from the SDR’s and SEF’s in the US. If I take a larger perspective onto the global derivatives market and pull the most recent BIS triennial report, I can see they claim the following global MXN and BRL interest rate swap activity:
- MXN: 10 billion USD equivalent per day.
- BRL: 16 billion USD equivalent per day.
Given that the BIS numbers are from April 2013, and given the large price swings in USD/MXN and USD/BRL FX rates, we should normalize those values back to domestic currency terms using historical April 2013 FX rates:
- MXN @ 12.00 = 120 billion MXN per day.
- BRL @ 2.00 = 32 billion BRL per day.
This is helpful, as we can now say that the 5.8 billion BRL per day that we see in SDRView demonstrates that the US can see ~20% of the global OTC swaps business, given the BIS numbers as the “universe”.
Regardless it is interesting to see that the BRL market would appear about 50% larger than the MXN market on a global scale.
SEF Activity
Lastly, let’s look at which SEF’s are handling the On-SEF flow in BRL interest rate derivatives. I have chosen to look at all Latam currencies from January 2014 to present:
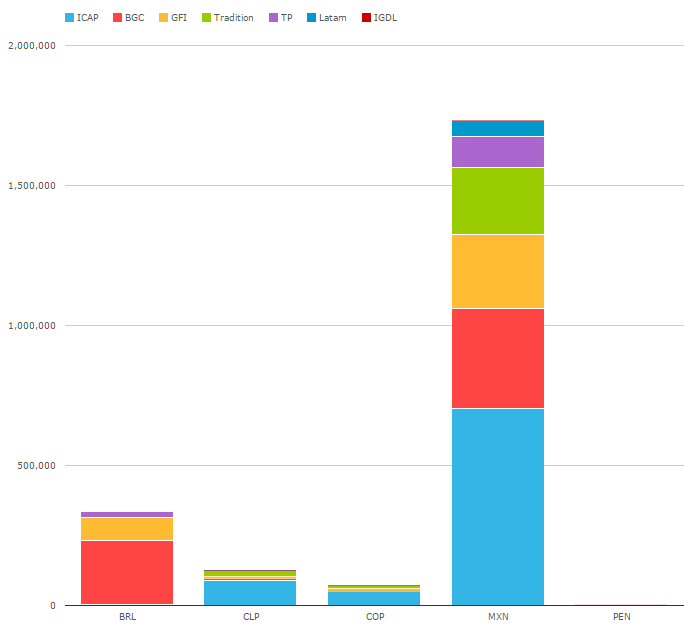
This shows:
- MXN is the Latam currency of choice on-SEF.
- BRL is primarily traded on BGC, with GFI and TP as the significant others.
- The scale is in millions, so that is ~300 billion of BRL traded in the past 20 months.
Summary
To summarize:
- BRL swaps have some unique characteristics, primarily being non-deliverable and one payment at maturity.
- SDR (US-named) activity would seem to reveal maybe 20% of the global BRL activity.
- 90% of these BRL swaps we see are executed off-SEF.
- BRL is the 2nd most active Latin American currency behind MXN.
- On a global scale, BRL is roughly 50% more active than MXN.
- One might extrapolate that given the adoption of MXN clearing, that we could see similar success for BRL swaps.
Lastly, one might further extrapolate that if CME can handle non-deliverable BRL, there are a host of other non-deliverable currencies – Korea, China and India come to mind – that may fit in nicely to an offshore cleared world. We can pull the numbers on that pretty easily, but I will leave it to you to check for yourself. If you want to dig into this yourself, log into SDRView.