The ISDA-Clarus RFR Adoption Indicator provides a set of monthly metrics that firms can use to monitor the progress of RFR trading in IRD markets, both ETD and OTC.
In this article, I explain why firms should also calculate RFR Adoption Indicators for their own trading.
Background
For those of you not yet familiar, below is an extract from the first page of the July 2020 publication.
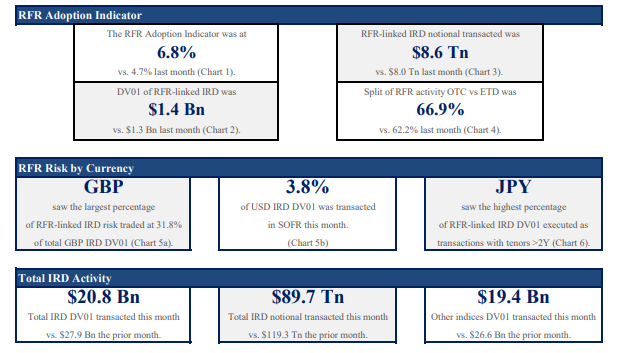
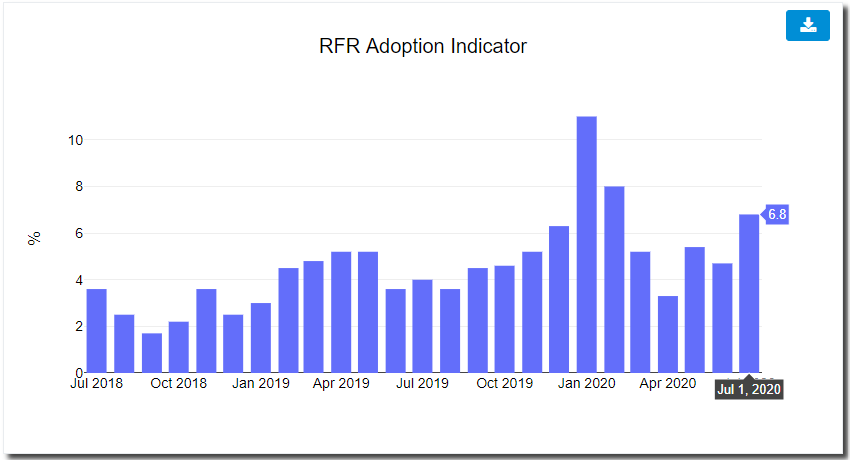
Showing the Indicator is 6.8% up from 4.7% in the prior month, along with selected highlights for other currencies and metrics.
The charts and data are available here.
What this tells us.
The 6.8% tells us that in July 2020 the risk that was transacted vs RFR indices (in major currencies) as a percentage of overall risk in Derivatives markets.
Or selecting specific currencies, we could see that for USD the July indicator was 3.8%, the highest on record, while for GBP it was 31.8%.
These indicators measure what the overall market is doing and by following them a firm can keep up to date on progress; how fast is RFR adoption growing month to month, where has it got to in a specific currency, at what point will it exceed 50% and so on.
The reason to follow the monthly publication of the RFR Adoption Indicators is clear.
And we hope you will encourage your colleagues and firm to do so.
What is less clear is why a firm should calculate the same metrics for its own trading.
Why Calculate your own?
The simple answer is that you need to monitor the progress that your own firm is making.
And that progress is not an absolute number but a comparison relative to the market.
Every firm should have an active IBOR Transition Program and by calculating and publishing internally these Indicators and comparisons, the project team can monitor their firms progress compared to the market.
- Did we trade a similar percentage of risk in RFRs compared to the market average?
- Or are we lagging, and what should we do to address that?
- Or are we leading and is that consistent with our business strategy?
The answer to lagging, leading or average should not just be qualitative and hearsay, but quantified and compared to the overall market and benchmarked to your peers.
I hope that states the case clearly enough.
How to Calculate?
The next question is how do you calculate?
Firstly the methodology is open, fully documented and available here.
Secondly the inputs are monthly volumes by currency, product, index and tenor bucket.
So it should be a simple matter of:
- collect your trade volumes each month,
- convert this volume into USD notional equivalents
- categorize in product (ETD, OTC), index (RFR, Other) and tenor (1Y, 2Y, 5Y, 10Y, 30Y, 50Y)
- convert from notional to dv01
- calculate the indicators as in charts 1 to 6.
Then compare with the public ISDA-Clarus RFR Adoption Indicators.
Any questions on methodology, please email us or reach out to your ISDA contact.
More Granularity
After comparing your own RFR Indicators with the public ISDA-Clarus RFR Adoption Indicators, you may also want more granular metrics and comparisons.
For example, comparing just Swaps in a single currency or Swaps longer than 2Y.
In this case, please contact us on how to get the equivalent metric for the overall market.
That’s It
Follow the ISDA-Clarus RFR Adoption Indicators.
Calculate your own and compare.
Quantifiable metrics lead to informed decisions.
Informed decisions to better outcomes.
With only sixteen months to go for LIBOR.
A lot of work remains.
Quantifying progress helps with focus.
Plan, execute, monitor and repeat.