For a while now I have wanted to look into more detail at Caps and Floors, which are an important but little commented on product type. So it is seems appropriate as we near first the Federal Reserve rate rise since June 2006, to look at a product designed to set a Cap (or Floor) on future interest rates.
First the highlights:
- 494 trades and $53b gross notional was reported to the DTCC US SDR in Nov 2015
- We estimate the actual gross notional to be close to $78b
- October 2015 was the highest volume month in the past 6 months
- Libor 1M and 3M are the most common reference indices
- 10% to 20% of total USD volume is On SEF each month
- SEF Market Share shows Tradition is top with 57% (for the last 6 months)
- Next are BGC with 21%, Tullet 12% and ICAP 9%
- EUR, GBP, JPY also show significant volume, especially in November
Now all the details with charts, data and more.
USD Cap Floor
Lets start by using SDRView to see the volume traded by US persons in Nov 2015 compared to other USD Interest Rate products.
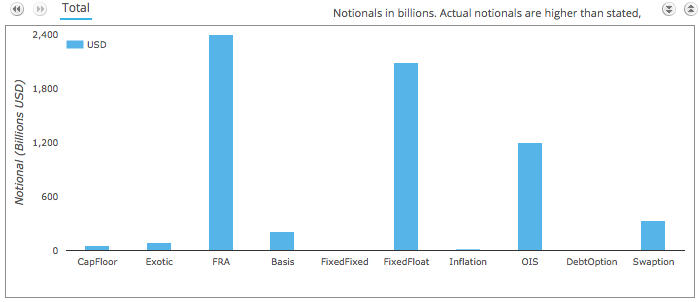
Showing that in November 2015:
- >$53 billion gross notional of CapFloors were traded
- The 7th highest product volume – just below Exotic and more than Inflation
- There were 494 trades
- Implying an average notional size of $107 million
- 26 (or 5%) out of the 494 trades were capped notional
- With these representing $13b (or 25%) out of the $53b gross notional
- So the true notional is higher than $53b and most likely much higher (more on this later)
We know that Cap Floors are all Uncleared but what about On SEF vs Off SEF?
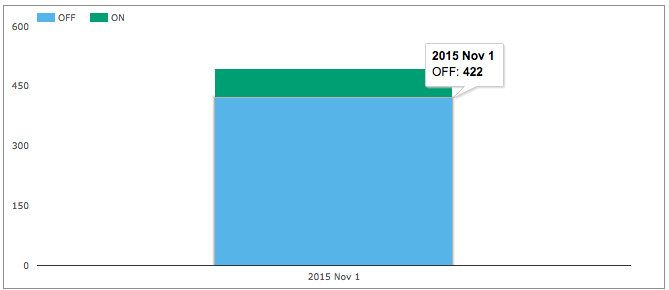
Showing that:
- 422 out of the 494 trades were Off SEF and 72 were On SEF
- $41b gross notional was Off SEF and $11.7b On SEF
Actual Volumes
Now we know that Capped Notional rules means that these volumes are under-stated, so lets split the above figures by how much is Standard (Actual Notional) and how much Capped.
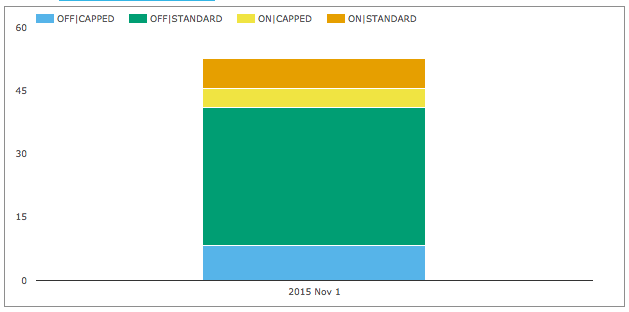
Which shows that Off SEF notional of $41b was from $8.3b of capped notional trades vs $32.7 of standard trades, while On SEF notional of $11.7b was from $4.6b of capped notional trades vs $7.1b of standard trades.
From the SEF Market Share section below we know that SEFs reported $21b gross notional in USD Caps Floors. Meaning that there as some very large trades above cap size going through On SEF. On the assumption that the same notional ratio for capped that is ON SEF, holds for Off SEF, we can make an estimate of the actual Off SEF gross notional.
We can then estimate that:
- The $4.6b notional of capped On SEF was $13.1b, to give a total of $21b
- A three times ratio
- Applying this to the $8.3b Off SEF Capped notional, gives $24.9
- Adding that to the $32.7b Off SEF standard notional, gives $57.6
- Our estimate for actual Off SEF is then $57.6b
- As On SEF is $21b, we estimate the overall total to be $78.6b
- Instead of the $53b reported in SDR
Volume Trends
Lets now use SDRView to look at monthly volume in the past six months by gross notional.
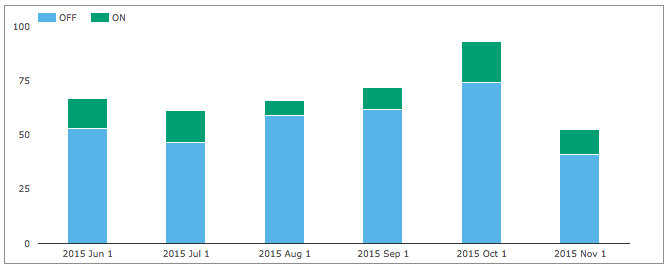
Showing that:
- October was the highest volume month with > $93b
- Almost double the November volume
- Generally steady amounts each month
- With 20% On SEF by gross notional
- Or 10% On SEF by trade count
Product Types
What types of products are traded?
- On SEF volumes mostly references Libor 3M, with some Libor 1M and some BMA 1M trades.
- Off SEF volumes is more mixed with lots of Libor 1M and 3M and ISDA-Swap-Rate and a few SIFMA Muni Swap, CMS-ISDAFIX and OIS index trades
- Caps are the most common type (not surprising given the low level of rates)
- Followed by Collars and Floors
Lets extract the data for November and create a few Excel charts.
First Product Type for the most common reference index, Libor 1M.
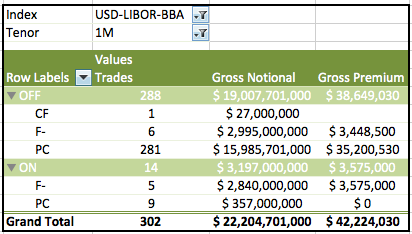
Showing that:
- 288 trades were Off SEF, with $19b gross notional
- 1 Floor of $27m
- 6 Collars of $3b gross notional
- 281 Caps of $16b gross notional
- 14 trades were On SEF with $3b notional
- 5 Collars of $2.8b notional
- 9 Caps of $357 m
- Gross premium does not appear to be reliable populated on every trade
- So these values are not as useful as they could be
And the same for Libor 3M.
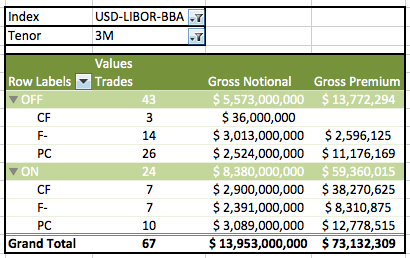
Which does show more Floors and more On SEF trades.
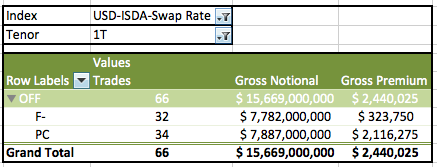
And one more before we move on; USD-ISDA-Swap Rate.
Strike and Tenors
Lets also take a look at the range of strikes and tenors traded in November.
And do so for Caps on Libor 3M.
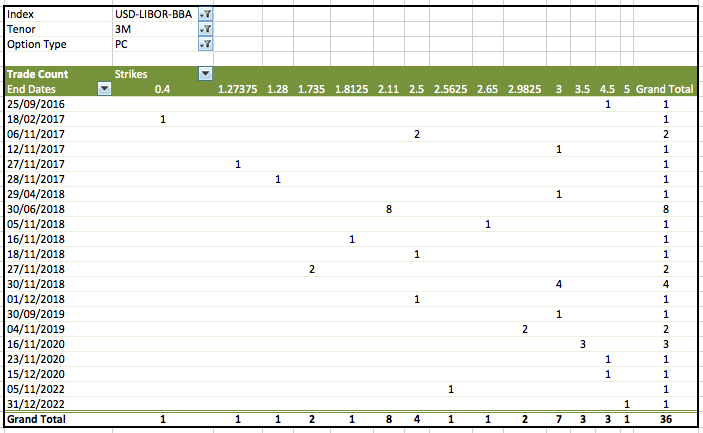
Showing that:
- Most trades are on specific strikes and end dates
- A few strikes and end dates have more than one trade
- 2.11% and 30/6/18 has 8 trades
- 3% and 30/11/18 has 4 trades
- Longest tenor is 5Y
We could look at Collars and Floors and other Reference Indices, but time is pressing.
SEF Market Share
Lets now use SEFView to see which platform has the most volume in USD.
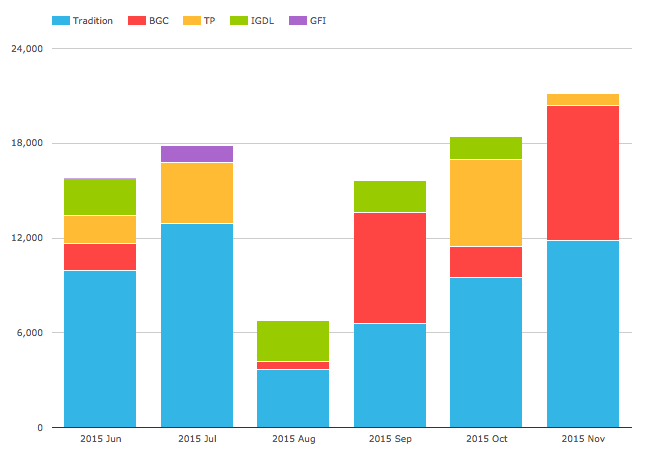
Showing that:
- Tradition has the largest share
- At 57% for the six month period
- BGC is next with 21%
- Tullet with 12%
- ICAP with 9%
- GFI with 1% but no volume since July
The total gross notional in November On SEF was $21b and this is the highest volume month in the prior six months.
EUR, GBP and JPY
And before we end, lets take a quick look at volume in the other major currencies.
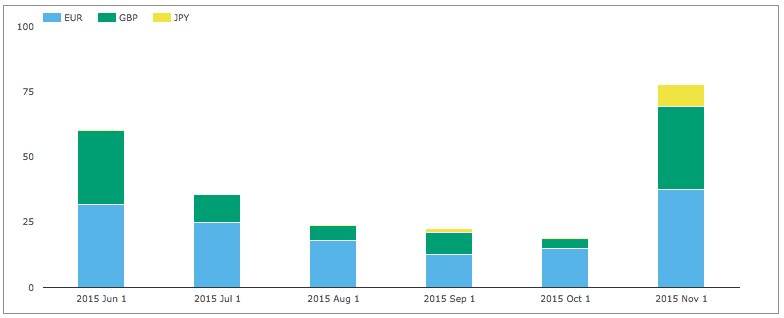
Showing that November had three times the volume of prior 3 months and this months gross notional is higher than the USD one, while usually it is far lower.
Thats it for a first look at Caps and Floors.
There is lots more interesting data to delve into.
For those so inclined, try yourself using SDRView.
And thank you for reading to the end.