What’s New in CCP Disclosures – 4Q23?
Clearing Houses have published their latest CPMI-IOSCO Quantitative Disclosures: Background Under the CPMI-IOSCO Public Quantitative Disclosures, CCPs publish over two hundred quantitative data fields covering margin, default resources, credit risk, collateral, liquidity risk, back-testing and more. CCPView has over 8 years of these quarterly disclosures for 44 Clearing Houses, each with multiple Clearing Services, covering the period from 30 Sep […]
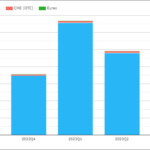
2023 CCP Volumes and Share in CRD and FXD
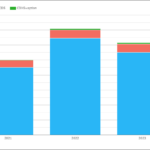
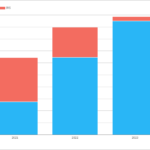
A review of Credit Derivatives (CRD) and FX Derivatives (FXD) volumes and market share at Clearing Houses (CCPs) in 2023. All the charts and detail from CCPView. Credit Derivatives Volume USD CDX, CDS and Swaptions CDX volumes at $11 trillion, representing 89% of USD volume with single-name 9% and CDXSwaptions just 1%. Market Share of USD […]
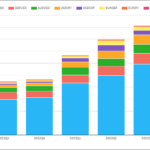
2023 CCP Volumes and Share in IRD
2023 volumes and market share for OTC Derivatives in Interest Rates reported by Clearing Houses. Clarus CCPView has daily volume and open interest data published by each CCP, which is filtered, normalised and aggregated to allow meaningful analysis and comparisons. Contents: Onto the charts, data and details. Volumes and Market Share For major currencies and regions, vanilla swaps referencing IBORs and […]
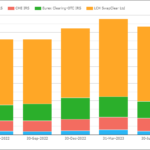
What’s New in CCP Disclosures – 3Q23?
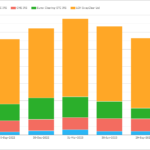
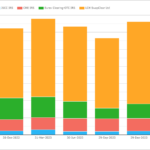
Clearing Houses have published their latest CPMI-IOSCO Quantitative Disclosures showing IM for ETD at $438 billion is down 2.5% QoQ and down 20% YoY, while IM for IRS at $283 billion is down 11% QoQ and up 1% YoY.
Read more to get all the detail.
3Q23 CCP Volumes and Share in IRD
Clarus CCPView has daily volume and open interest data published by each CCP, which is filtered, normalised and aggregated to allow meaningful comparisons of volumes. Today we look at 3Q23 volume and market share in IRD for: Onto the charts, data and details. Volumes and Market Share For major currencies and regions, vanilla swaps referencing IBORs and OIS […]
3Q23 CCP Volumes and Share in CRD and FXD
A review of Credit Derivatives (CRD) and FX Derivatives (FXD) volumes and market share at Clearing Houses (CCPs) in 3Q 2023. All the charts and detail from CCPView. Credit Derivatives Volume USD CDX, CDS and Swaptions Overall volumes in 2023Q3 at $3.35 trillion as compared to $3.75 trillion in 2022Q3. Market Share of USD CDX The […]
Central Clearing of US Treasuries
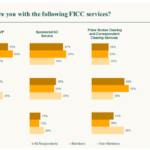
I published an article on the ION Markets Blog, please read at Central Clearing of US Treasuries. It highlights a recent DTCC White Paper on Assessing a Potential Expansion of U.S. Treasury Central Clearing, which includes findings from a survey.
What’s New in CCP Disclosures – 2Q23?
Clearing Houses have published their latest CPMI-IOSCO Quantitative Disclosures: Background Under the CPMI-IOSCO Public Quantitative Disclosures, CCPs publish over two hundred quantitative data fields covering margin, default resources, credit risk, collateral, liquidity risk, back-testing and more. CCPView has over 7 years of these quarterly disclosures for 44 Clearing Houses, each with multiple Clearing Services, covering the period from 30 Sep […]
Clearing of US Treasuries – What Are People Saying?
The SEC issued a proposal last year regarding a potential clearing mandate for cash treasuries and repos. There is a good two-pager summary from the SEC here: Or you can choose to read the entire proposal here: Clearing of Cash, Repo and Swaps are all different First of all, I think it is important to […]
How large are Cleared Swap markets?
I published my first article on the ION Blog covering Cleared Swap markets and comparing open interest and volume between Swaps and Futures for Interest Rate Derivatives. Please read at How large are Cleared Swap markets?