A few times last week I heard concerns about whether clearing of Single Name CDS will ever take off. It inspired me to examine the data we have on hand for credit derivatives, both index and Single Name, to see what I can make of it.
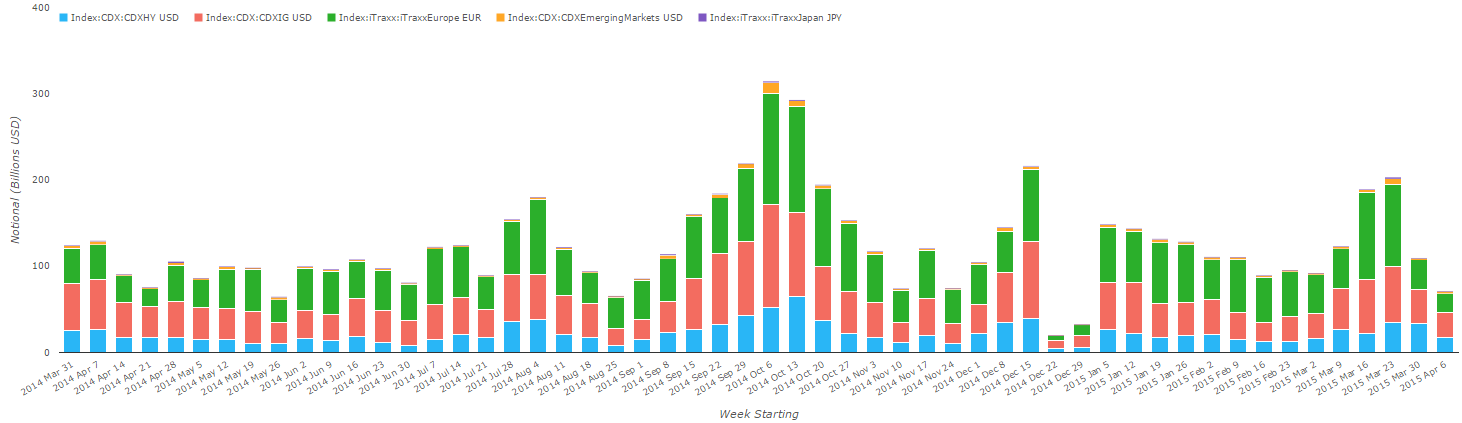
While we’ve written lots of articles on OTC swaps, very few of them have focused purely on Credit. Why is that? Well for starters, the CDS Index game is largely “securitized” already. The chart below shows weekly SDR trading activity of CDS Index for the past 1 year, spanning the 5 major indices. The bulk of this activity is already on-SEF and cleared. You’ll have to trust me on that, or use SDRView yourself to confirm.
Further, Single name CDS are a SEC-governed product, so there is still very little public transparency into the trade data. Occasionally we’ll see some single name swaps go through on SEFView and SDRView, but frankly I’m not sure how or why. I should note two things:
- Security-based swaps will have their time soon enough, as the SEC announced in January 2015 that they are working on rules for them.
- DTCC TIW (not SDR) do publish rafts of aggregated data, just not at the trade&price level of transparency.
Until then, the only data we have at hand for single name is CDS clearing data, which we provide on CCPView.
Data
Lets start with clearing data across all credit default swaps. I will use our terminology “CDX” to refer to all indices, and “CDS” to refer to all single-name swaps. The chart below looks at daily clearing activity since December 1, 2014.
A general word of caution in all of this data is that this data spans both dealer and client. Here, I have to rely simply on anecdotes that state the vast majority of cleared credit is dealer business.
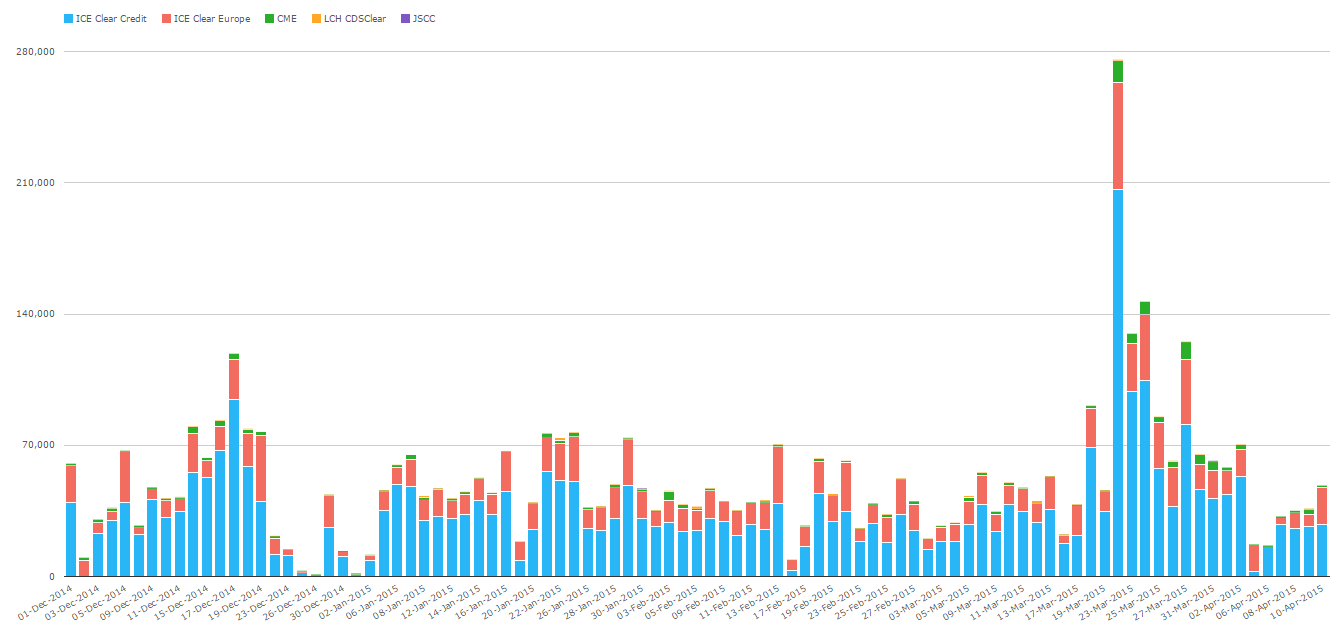
Right off the bat, we can observe:
- There are 5 players in clearing: ICE (US & Europe), CME, LCH, and JSCC.
- ICE dominates this space.
- ICE Clear Credit handles the bulk of clearing, while ICE Clear Europe handling much of the remainder.
- March activity peaks likely due to the rollover to new contracts
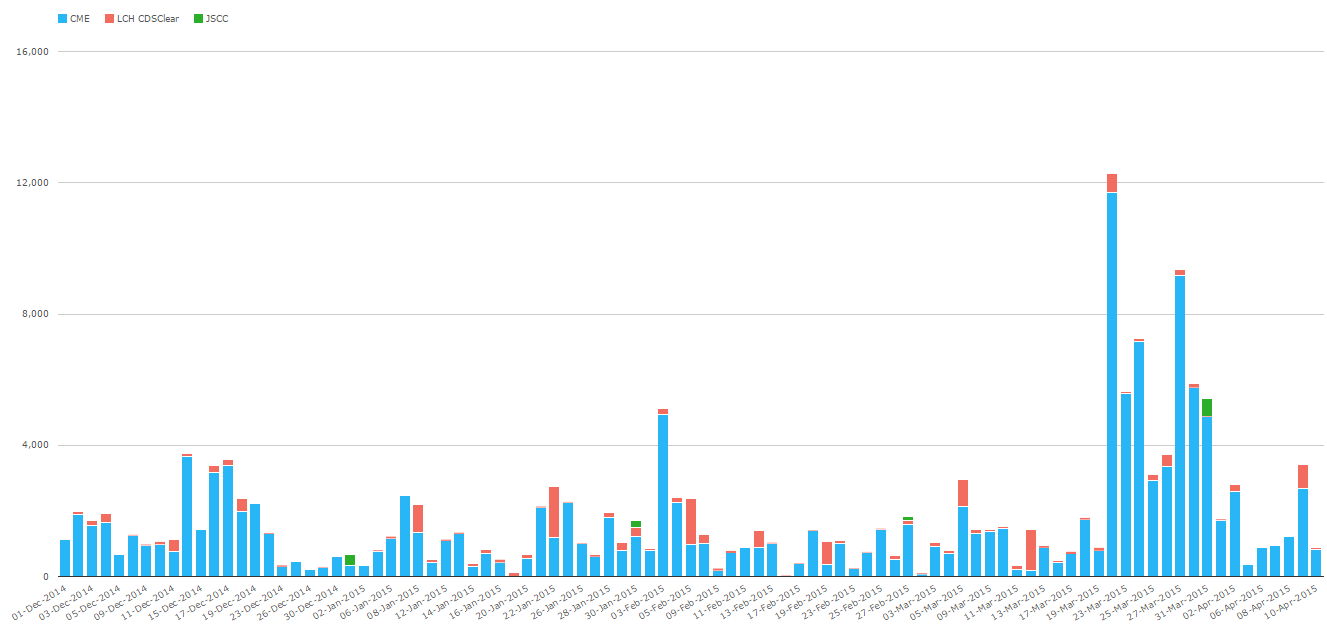
In order to see the scale of CME, LCH and JSCC, we need to remove the two ICE clearing houses. CME is now the blue bar, LCH red, and JSCC the occasional green blip you will see. I should warn that JSCC reports their activity on a monthly basis, so their clearing volume is lumped onto the last day of the month. Monthly reporting is not too bad when you consider they currently clear on a weekly basis:
Lastly, no view of clearing is complete until you have the obligatory Open Interest chart showing some big numbers:
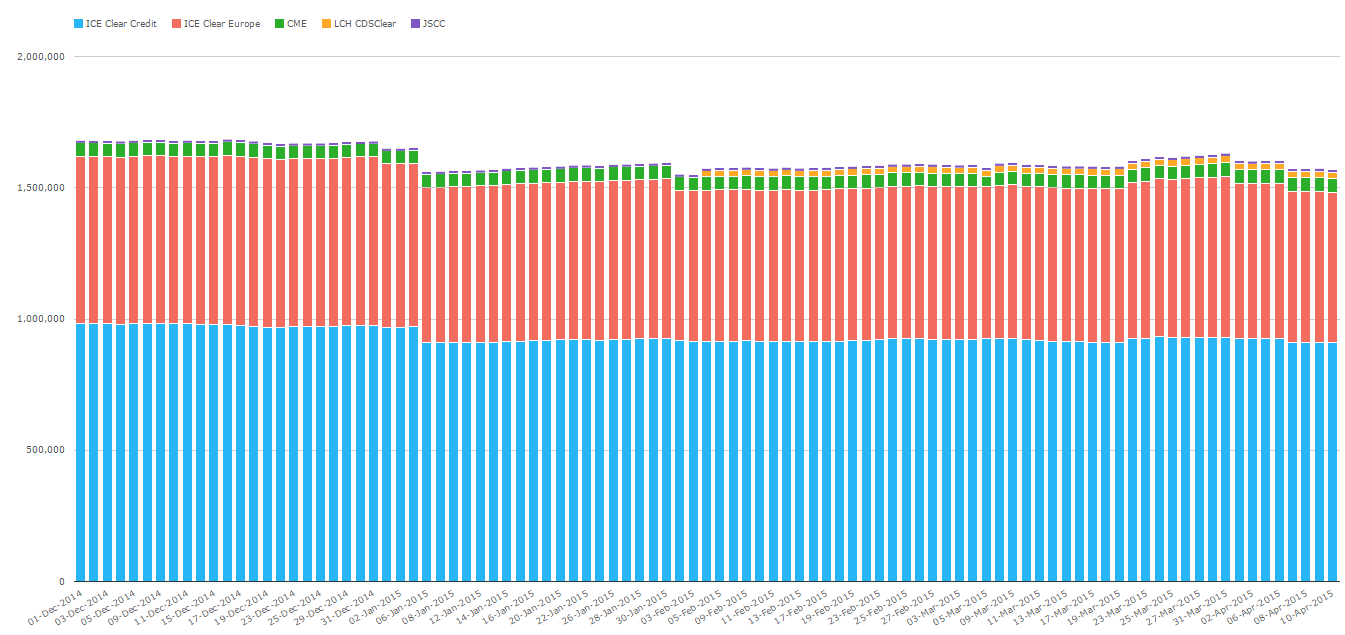
The cleared market in credit stands at roughly 1.55 trillion dollars. Perhaps interesting to note the Jan and Feb reductions in OI at ICE. This is one of two things:
- Some sort of termination activity.
- A quirk in USD-Equivalent Open Interest calculations. Because we update our FX rates on a monthly basis, we (and everyone) are prone to quick changes in OI.
Because clearing houses actively compress contracts on a daily basis, these OI changes would seem to be more of the latter. However when I looked closer at the data, I discovered that the first big drop down was on January 6th. The EUR/USD rate was adjusted properly on January 1st, so there is likely more to it than just FX translation. If I had the energy to drill into the index or single name(s) that caused this, I would, but I will leave that for now as food for thought, and possibly another blog.
What is Cleared
So where does it all come from? The following table breaks out clearing activity by what we call Product Sub-Type:
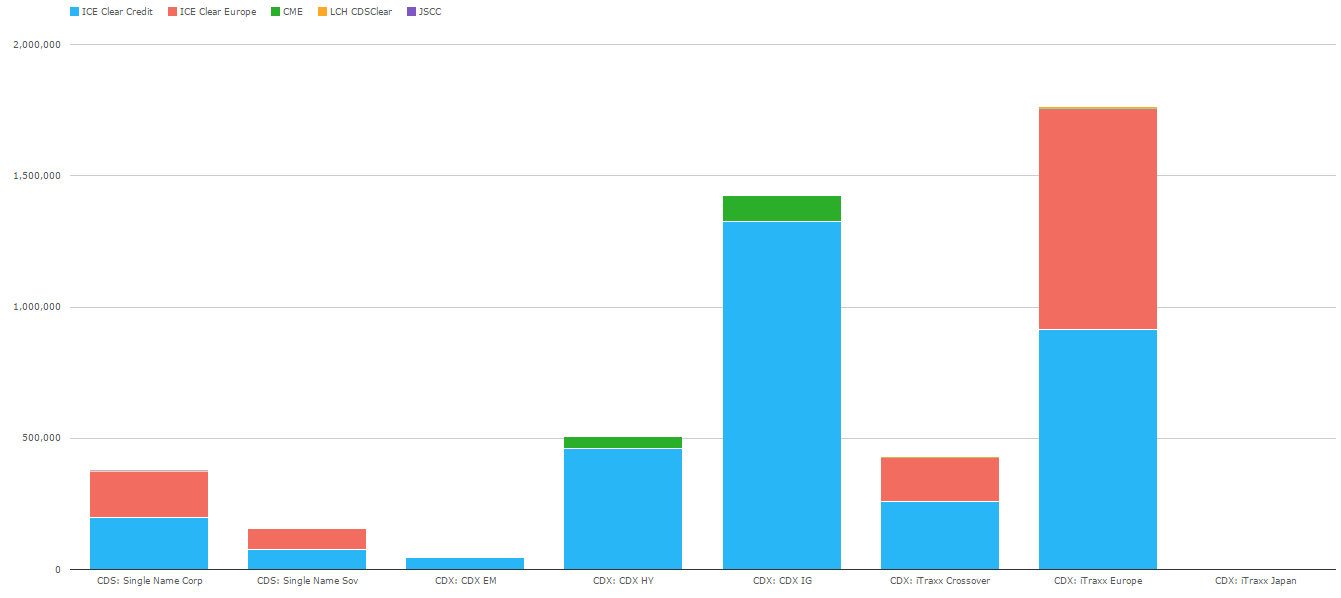
Couple things of note here:
- European iTraxx and CDX IG are the largest contributors.
- I was somewhat surprised to see the scale of Single Name activity. One would need to balance the fact that these are not mandatory cleared instruments vs the dealer’s need (?) to fulfill their fed letter “requirements”.
- I should note that JSCC began clearing Single Name Corporate swaps in January of this year. You can almost make out a bit of green within the Single Name corporate bar.
Next up, lets look at Open Interest in these instruments:
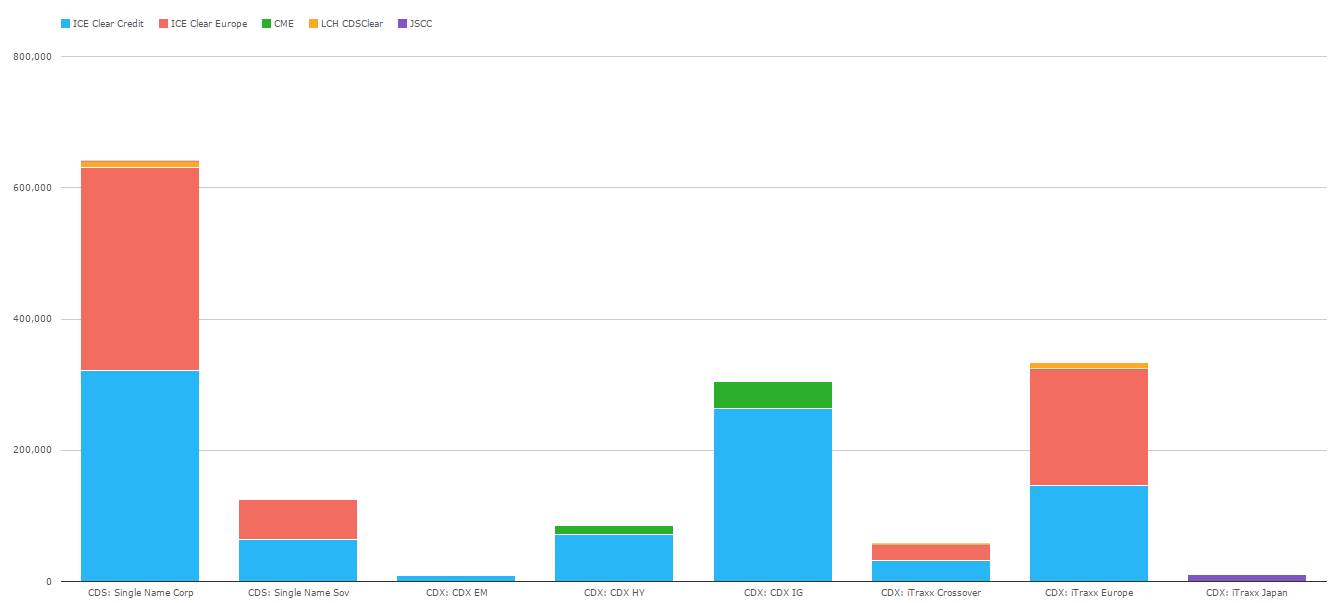
What I find interesting here, once again, is the scale of open interest in Single Name CDS. This tells us that while single name swaps represent roughly 11% of the daily activity of credit clearing, they represent 40% of the ~1.55 trillion in open interest. Surprising? It shouldn’t really be, when you consider the sheer amount of single names out there vs the handful of liquid indices. Should also remember that some amount of the CDX OI represents a hedge to the Single Name CDS OI.
Which Single Names Matter
Just for laughs, I decided to download the single name data into excel and whip up a chart on the OI:
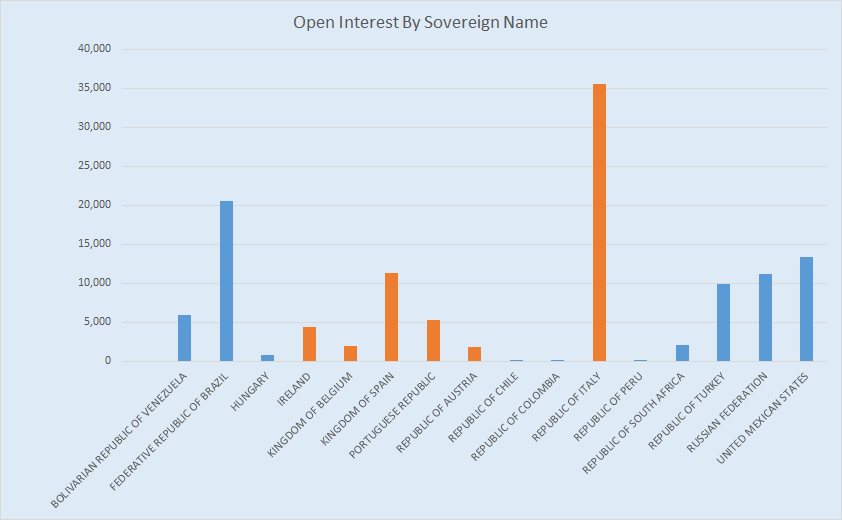
I couldn’t readily get a CCP legend to show up when I stacked the results, so you’ll have to take my word that orange is ICE Clear Europe and blue is ICE Clear Credit. As for the data, not surprising. CDS contracts in Italy represent:
- Approximately 30% of the total cleared single name sovereign market.
- Larger OI ($35.6 bn) than iTraxx Europe Crossover that is cleared at either ICE Europe (~24.9 bn) or ICE US (~31.5 bn).
- Nearly equivalent to the total OI of CDX HY cleared at CME (~40.5 bn)
I attempted the same analysis for single name corporate CDS. Because there are literally hundreds of names cleared, and charts don’t behave well with 566 names in it, I limited my chart to the top 20 names. Here, I managed to get a legend to show up for the stacked data.
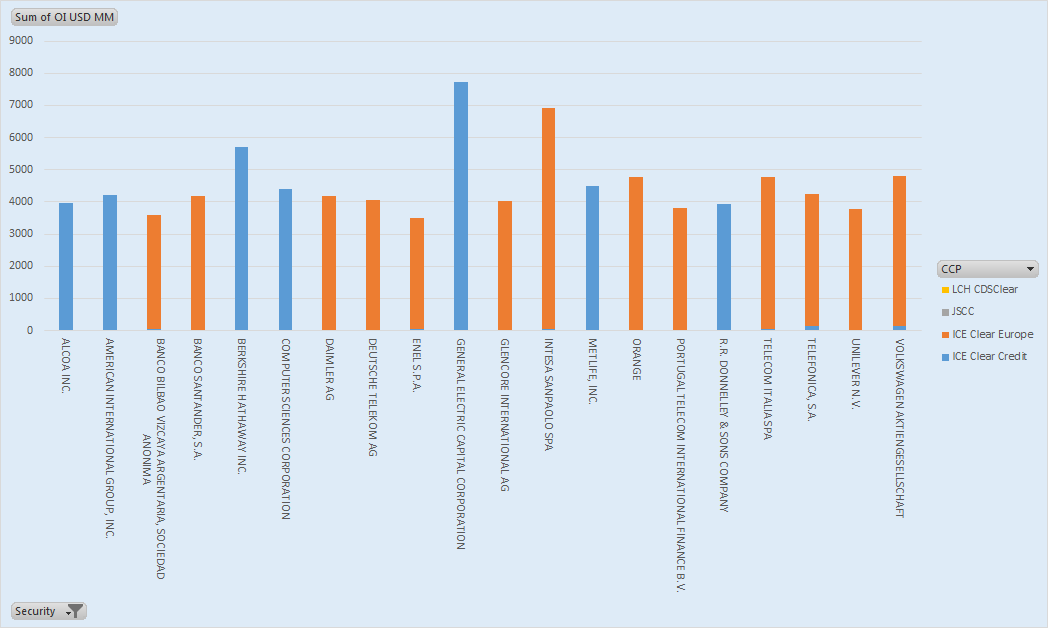
All well and interesting.
What Percent is Cleared
So how much of daily activity in single name is cleared? I don’t believe there is a single source that tells us this. But if I:
- Take the total cleared amount for a particular name from CCPView for a week
- Take the total new activity for that name from TIW for that same week
- I should be able to determine, at least for that one name, what percent was cleared.
Sounds simple, but you need to understand how TIW reports their activity.
First part is easy, here is the weekly cleared activity for the top 20 names that week at ICE Clear Credit:
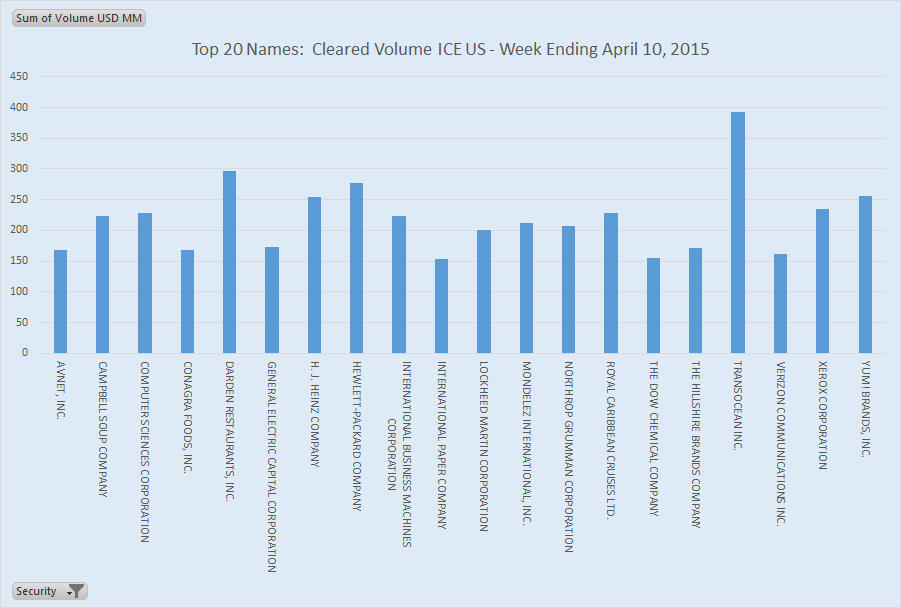
Sizing up the entire market of cleared & uncleared is much trickier. Using TIW data, there is a myriad of additions (new trades, assignments, backloads, etc) and reductions (terminations, post-trade-events, etc). If I pluck a few large numbers out for Computer Sciences Corporation:
- 1.52 bn USD of new trades
- Adding 1.15 bn of “PTE”, lets assume some assignment
- Gives us ~2.67 bn USD of new activity
- 1.46 bn USD of terminations
- Adding some other “PTE” amount of 1.16 bn.
- Gives us ~2.62 bn USD of reductions.
Now, I’d really have to dig down and make some assumptions on what all these PTE events mean at the clearing house. Alas, I will disregard all of the “reductions”, and I’ll even disregard the assignments. Doing so gives me:
- 228 mm cleared activity
- 1.52 bn total activity
- Hence 15% of the market in that name was cleared
I’m not terribly comfortable with that analysis at all. Its hard to disregard billions when your denominator is only a billion. If any readers have some guidance, I would pledge to update the analysis.
Trends
Going back to where this all came from, I wanted to spot some trends in the clearing data, particularly in single name CDS. So, I put together the following chart, for what its worth. Again this is dealer and client combined:
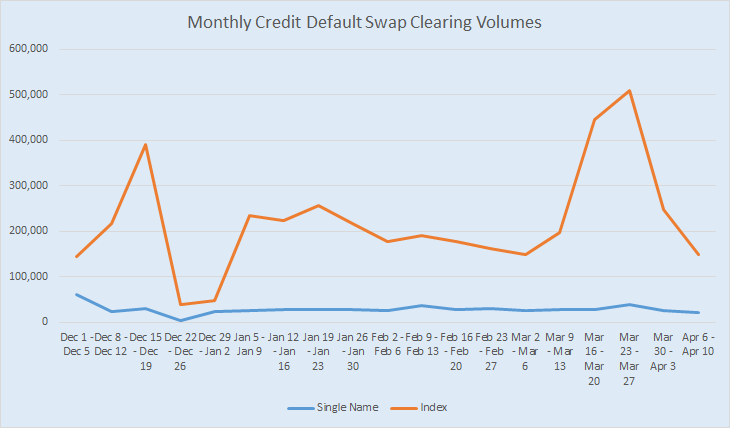
Very hard to make much out of that. Alas, it’s not a topic you can monitor readily with clearing data alone. Whilst I uncovered some interesting data tidbits during my exploration, this really can’t help me understand if there has been a growth in the cleared CDS market.
I believe the theory goes something like this:
- Single name CDS trading is a shell of its former self
- Due to costs (primarily capital costs), dealers are pricing cleared CDS more aggressively (vs bilateral)
- This should drive more firms to clear voluntarily
- As more firms clear, more dealers will make markets in Single Name CDS
- As the cleared swap world grows, you’ll start to find a healthy SEF (or SEF-like) market for Single Name CDS. (Would this be an SB-SEF?)
- At that point, Mary and Joe Consumer will be able to trade CDS mini contracts on their ETrade accounts, and in so doing, destroy any chance Italy has at solvency.
OK maybe that last point is a stretch, but I’ll leave it there for now. I hope some of the data proved interesting.