As we recently released the CDSIndex product in SDRView Professional, I decided to look at what the SDR data shows.
CDS Index NA
Lets start with a chart of the daily volumes on 24 Jan 2014, of the major North American indices; IG, HY and EM.
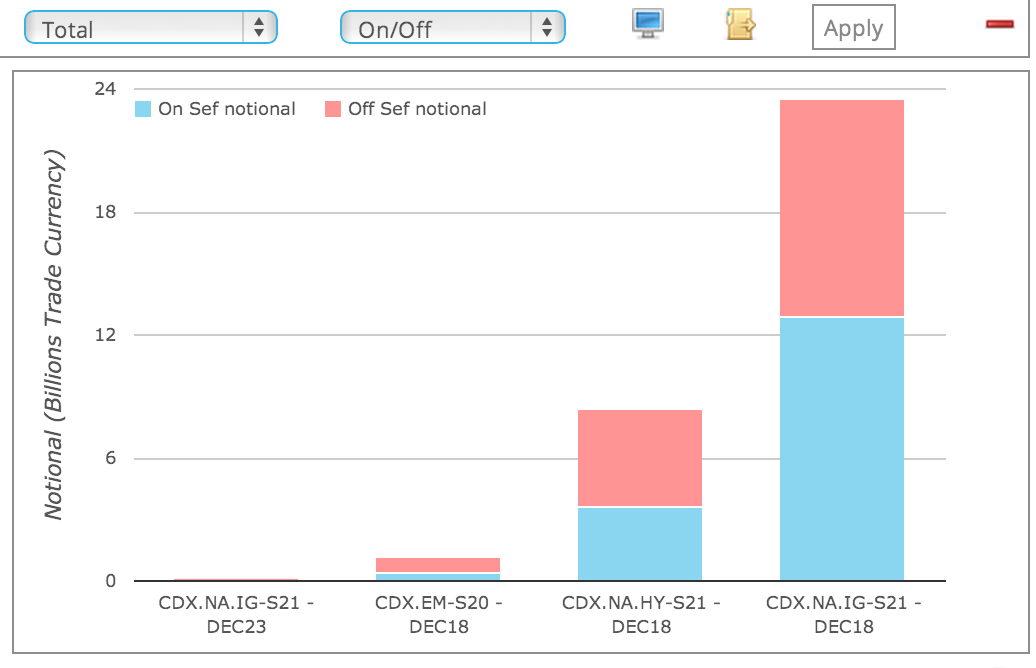
This shows the following:
- IG 5Y (Dec18) has by far the highest volume at almost $24 billion.
- Of this On SEF is $12.9 billion and Off SEF is $10.6 billion
- HY 5Y is the next highest at $8.5 billion of which On SEF is $3.6b and Off SEF is $4.8b
- EM 5Y is $1.2b
- IG 10Y has very low volume
- Across these 4 Indices more than $33billion is traded on this day
On SEF vs Off SEF
Now lets look at separate tables of trade counts, gross notionals and prices.
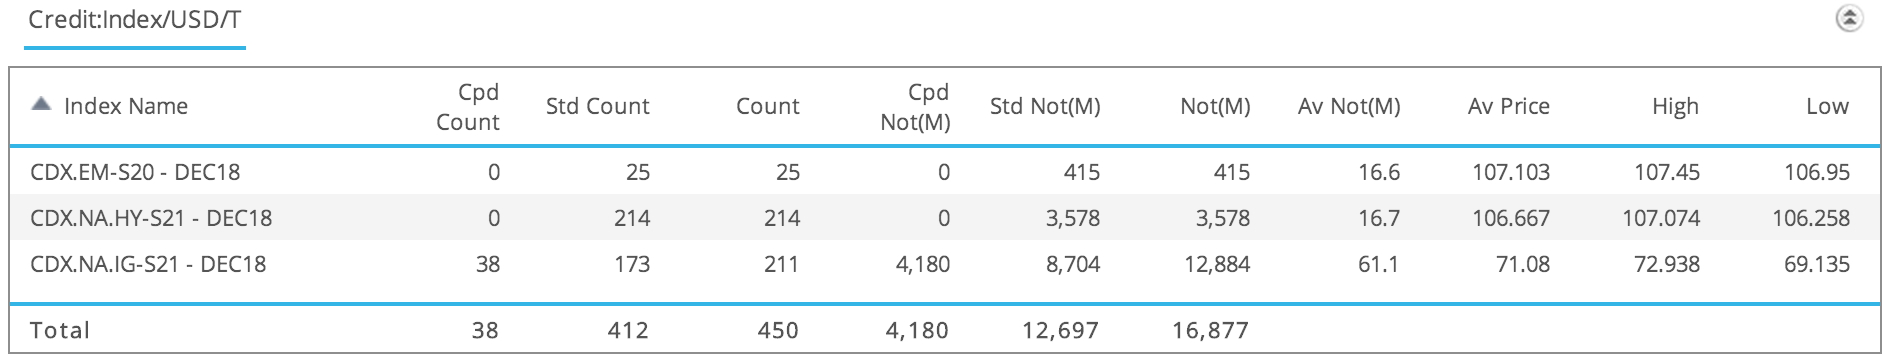
Firstly On SEF:
Then Off SEF:
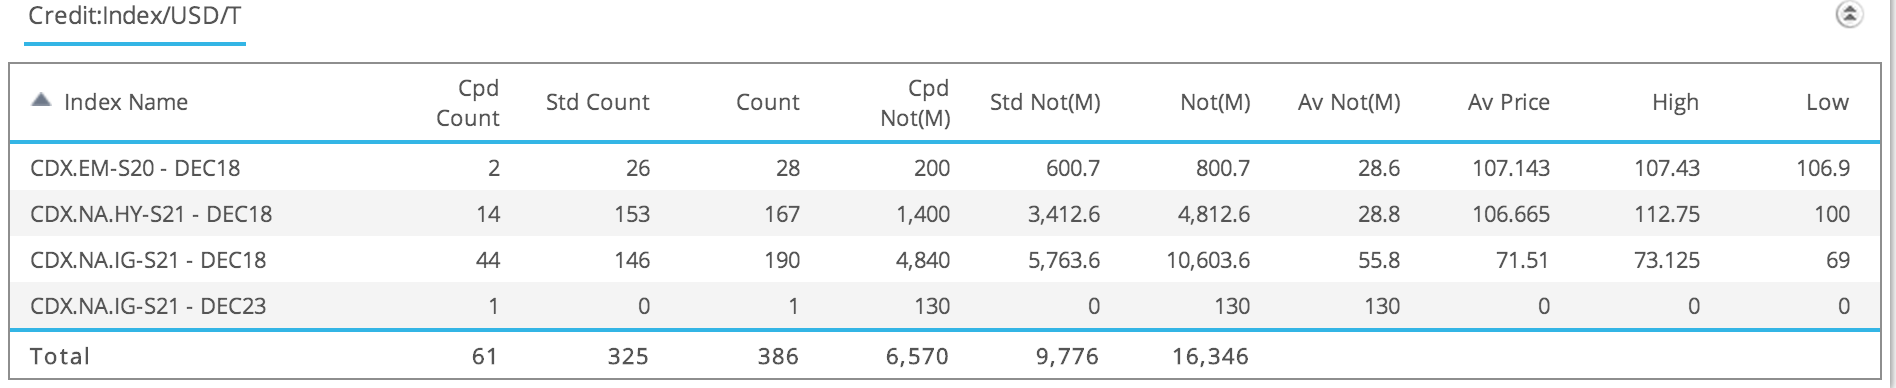
From these we can observe the following for 24 Jan 2014:
- The overall gross notional for the 3 Indices between On SEF and Off SEF is similar at $16 billion.
- The number of trades is higher for On SEF at 450 vs 386 for Off SEF
- The average notional per trade is similar between On SEF and Off SEF
- The Avg Price is very close for HY, but less so for IG & EM.
- High and Low prices look tighter for On SEF
- More Off SEF trades are larger than the Capped size; 61 vs 38.
- Volumes are understated due to these Capped sizes
- The IG Capped Size is $110m, the HY $100m
- So the overall $32 billion is probably understated by at least $10 billion.
Cleared vs Uncleared
Now lets look at tables of Cleared and Uncleared volumes.
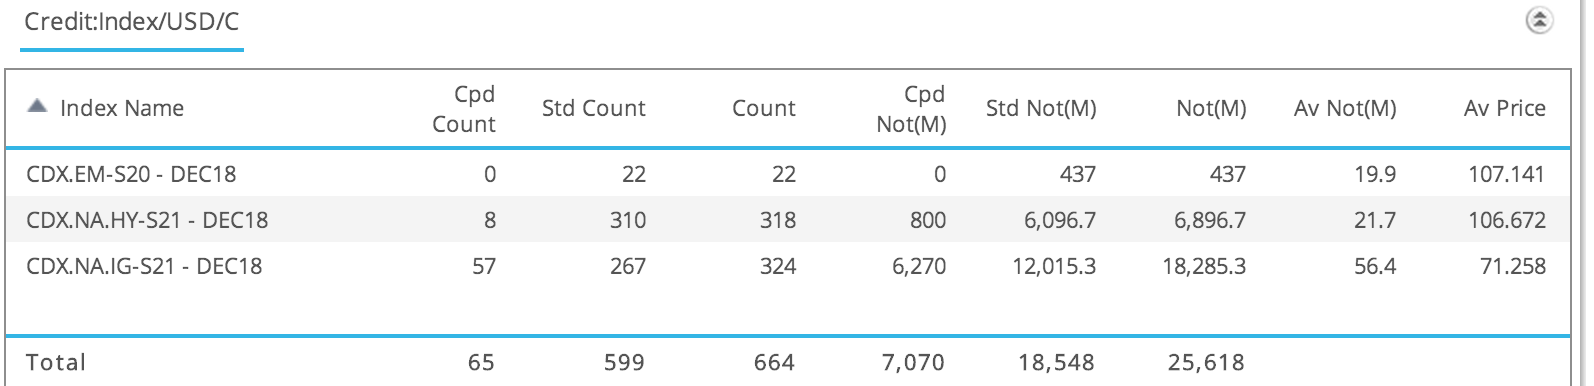
First Cleared.
Then UnCleared:
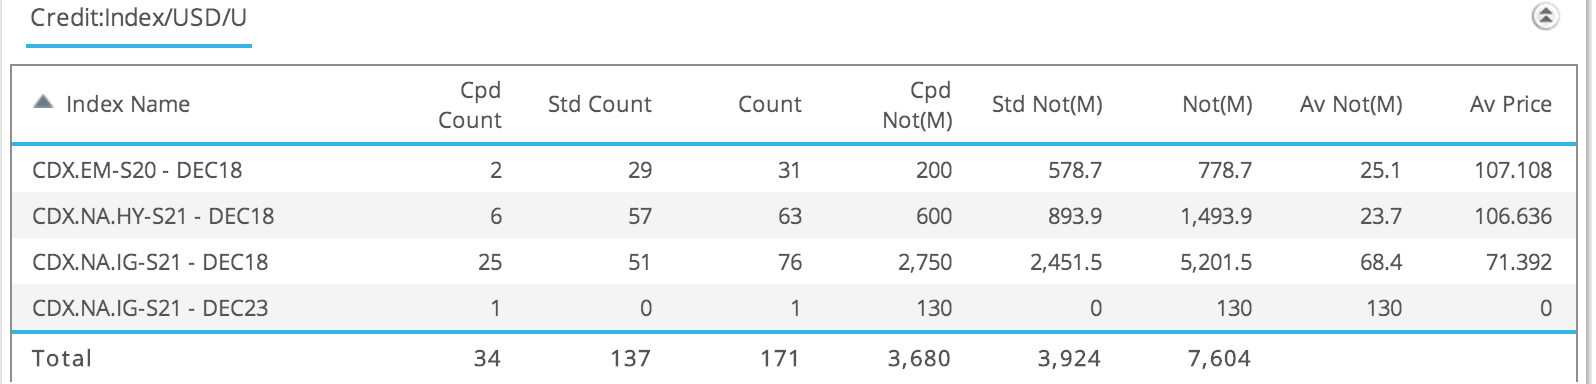
Which simply tells us that:
- a lot more trades (664 vs 171) are Cleared than UnCleared
- or $25 billion vs $7billion
ITraxx Europe?
Lets now take a quick look at Europe.
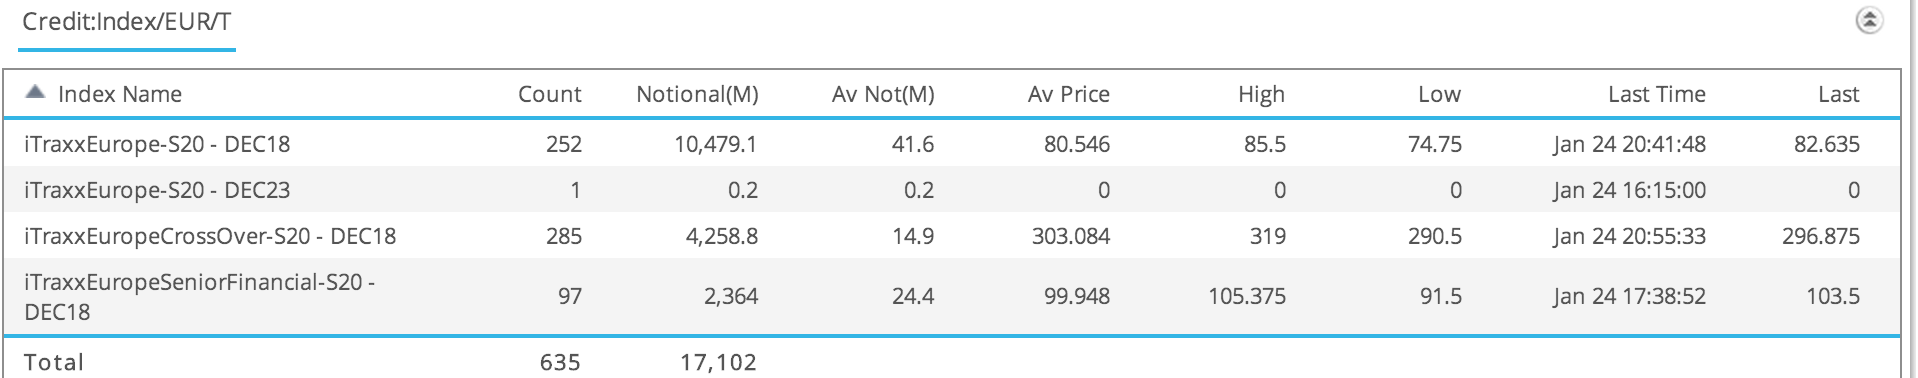
From which we see that on 24 Jan 2014:
- 635 trades representing more than €17 billion in notional is traded
- With the main iTraxx Europe Index representing more than €10 billion
- Followed by CrossOver at €4 billion and Senior Fin at €2 billion
- Average trade size is lowest for Cross Over at €15 million
Summary
CDSIndex intra-day trading activity is now available in SDRView Professional.
CDX.NA.IG.5Y is the most traded index, with more than $24 billion traded on 24 Jan 2014.
ITraxxEurope 5Y is the next most traded (€10b), followed by CDX.NA.HY ($8b).
Other than 5Y maturity, hardly anything trades.
For CDX, On SEF and Off SEF Volumes are similar, while for iTraxx Europe, Off SEF are higher.
Cleared volumes are much higher than Uncleared.
Capped sizes for CDX.NA.IG.5Y of $110 million, mean that 25% of trades are impacted, leading to an understating of notionals.
Trade prices with Avg, High, Low and Last can be readily observed.
I invite you to sign-up for a free trial and see the CDSIndex trading activity for yourself.