Recently we introduced exchange traded derivatives in CCPView, allowing us the ability to start exploring this world alongside the OTC market more holistically. Many of you know we already track some futures in SEFView, however the universe in SEFView is SEF-executed trades; whereas in CCPView we can now look at the entire world of cleared derivatives.
We’ve begun with CME -cleared Interest Rate Futures. So this spans:
- Money Market Futures (Eurodollars and bundles)
- Bond Futures
- Swap Futures. Both the CME listed DSF variety, as well as the Eris Standards and Flexes.
Cleared OTC and ETD Activity
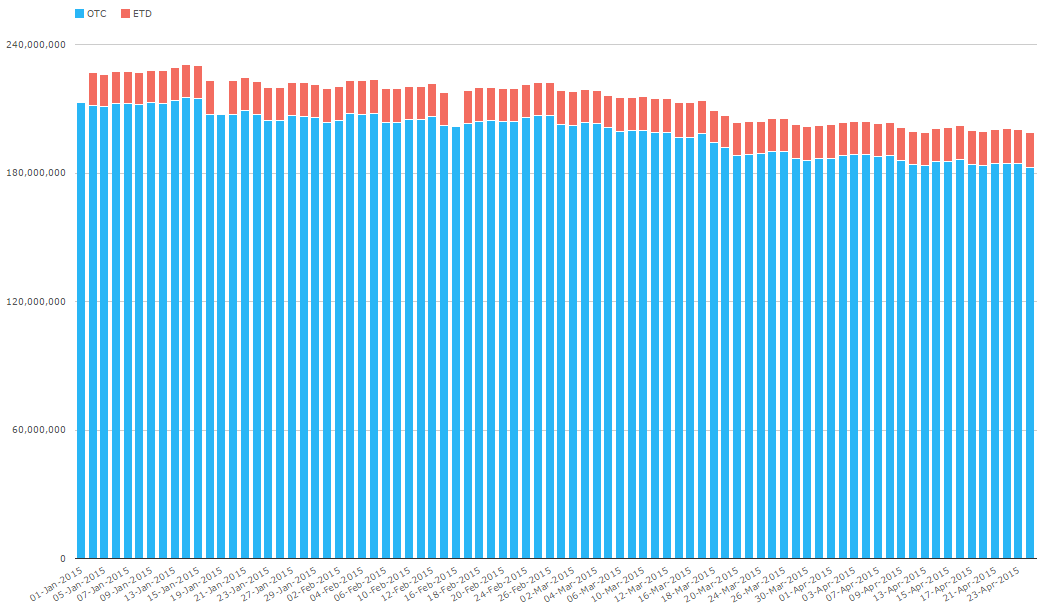
Lets have a look at what daily volume looks like, across all Interest Rate Derivatives:
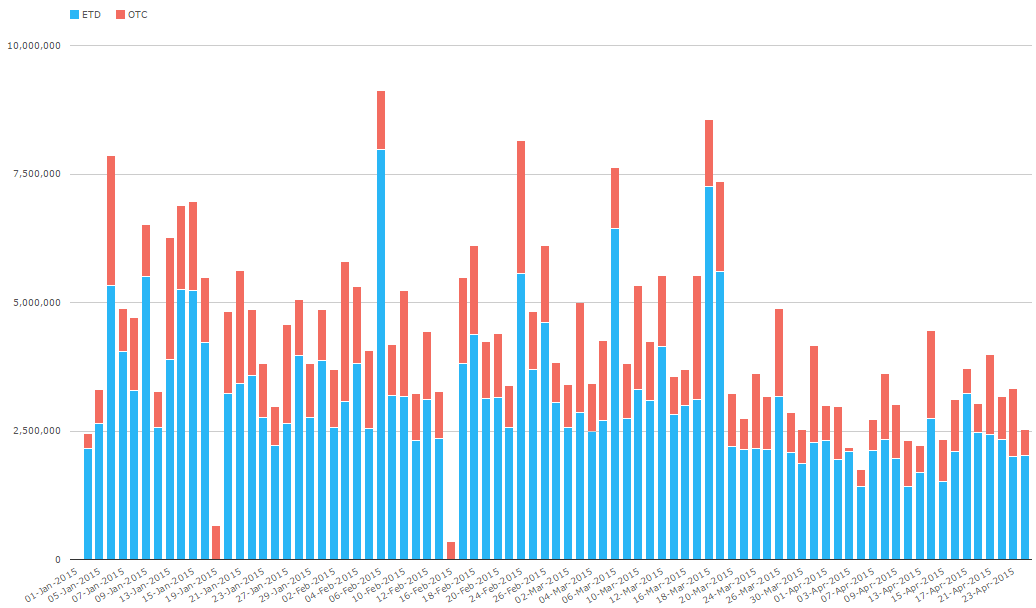
So to be clear, the universe of OTC here (in red) is all currencies, all cleared IRD products (Vanilla swaps, basis, FRA, OIS, ZC, etc). It would seem the ETD market of just the CME trumps this in notional terms.
Now stripping that same data back to just USD-denominated instruments:
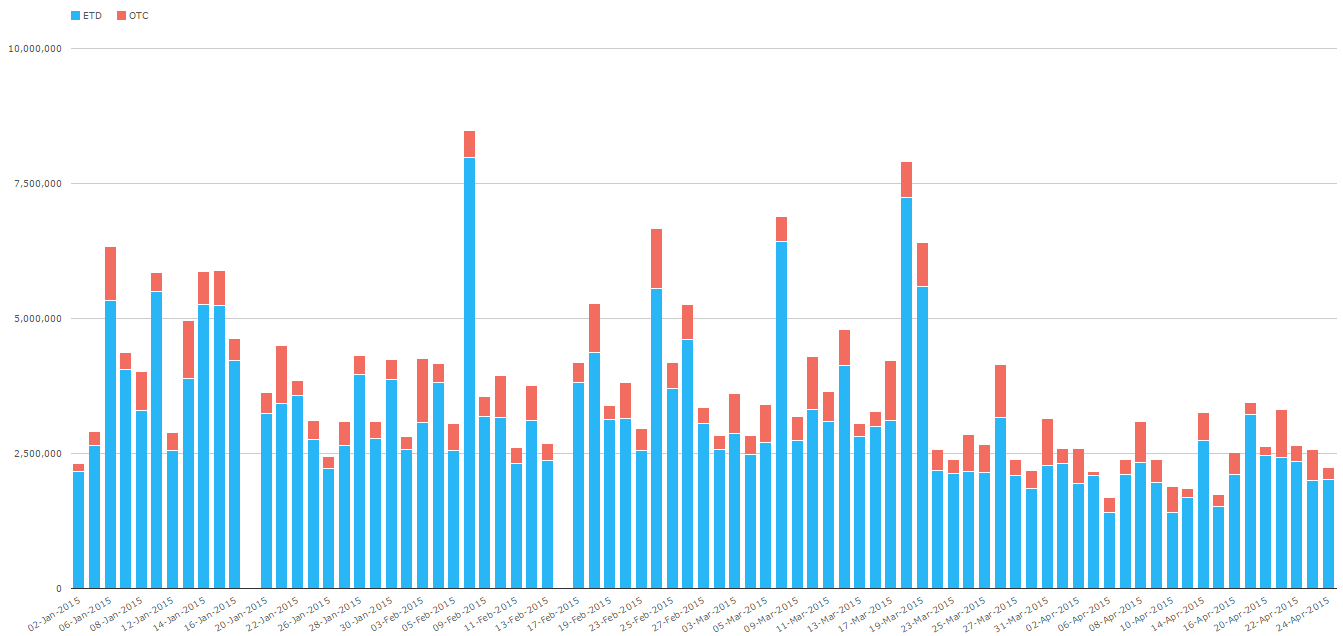
By now, we should all know the dangers of talking in notional terms when it comes to derivatives. Clearly a 10 million USD Eurodollar position pales in comparison to a 10 million USD 30Yr swap. Unfortunately some of the OTC data that is published by clearing houses fails to report the tenor, so we’re unable to put these notionals into risk perspective.
However we can drill deeper and examine just the ETD’s:
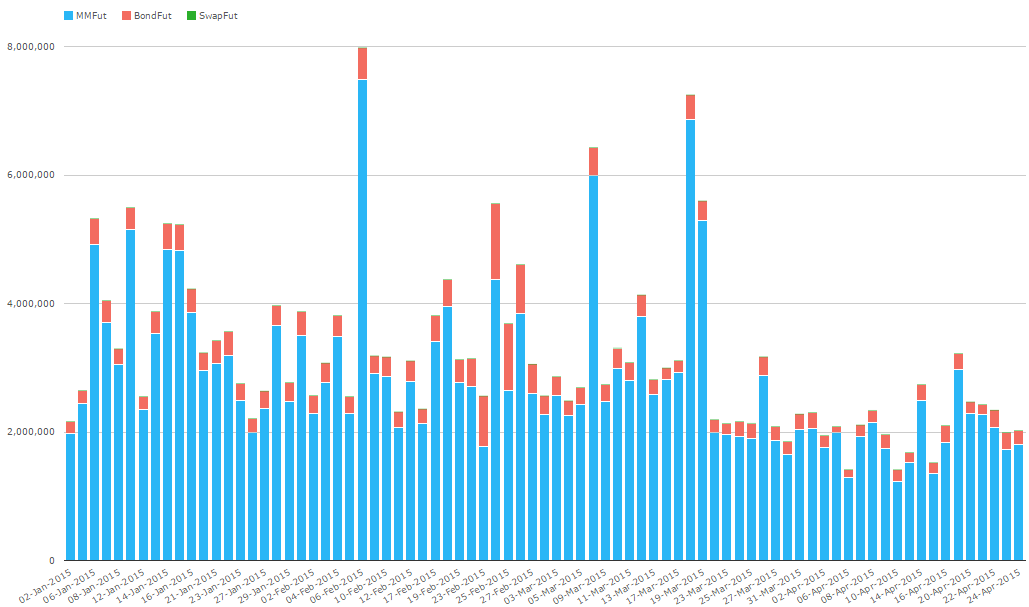
This seems to tell us that the vast majority of the ETD is MM futures. Which as we all know are short dated. And then drilling one level further, we can see the type of MM Futures:
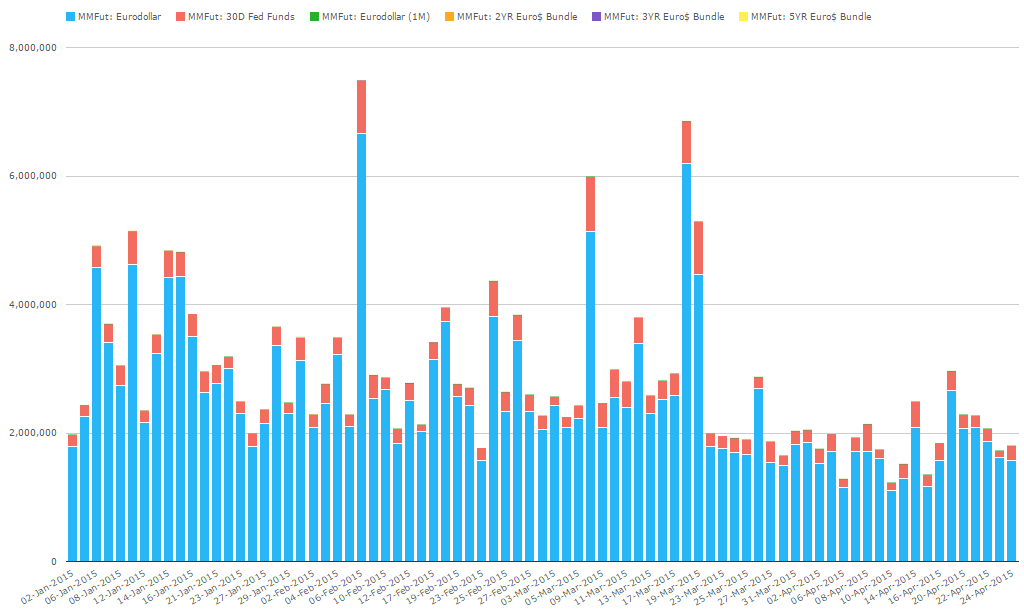
So fairly clear that its the Eurodollar futures activity that is the largest. Interesting to note that the Eurodollar bundles seem to be inconsequential to the activity.
Open Interest
The previous analysis above was all Volume based, so what about OI?
What should be obvious is that while the daily activity of ETD trumps that of OTC, the open interest in OTC vastly surpasses that of ETD. Confirms the intuition that while billions of notional is traded each day, that much of this activity is closed out and netted on a daily basis. In fact if we compare Daily Volume to OI for IRD and Futures, we get:
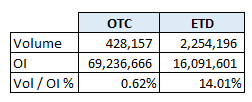
Telling us that 14% of open interest is transacted daily in ETD, whereas only a fraction of 1% of open interest is transacted daily in OTC. As you’d expect, but good to see this in numbers.
Like for Like / Swap Futures
Lets look Swaps vs Swap Futures. We’ve done this before in SEFView, but now we have the universe of Cleared IRS to compare it to. So, just for USD IRS (Vanilla) vs USD SwapFutures:
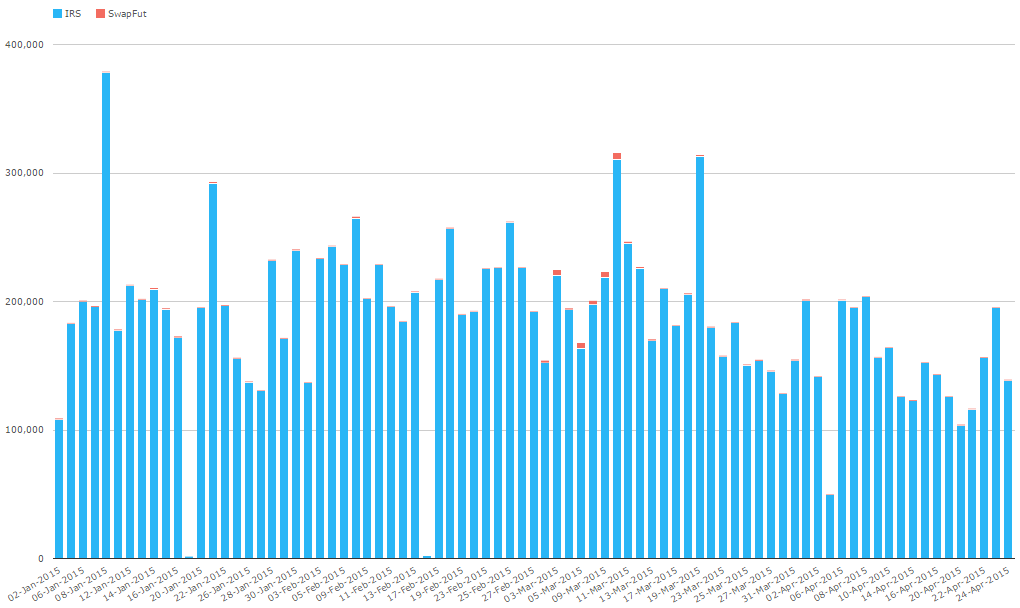
Clearly swap futures have a long way to go, now that we are including the cleared IRS from the rest of the world.
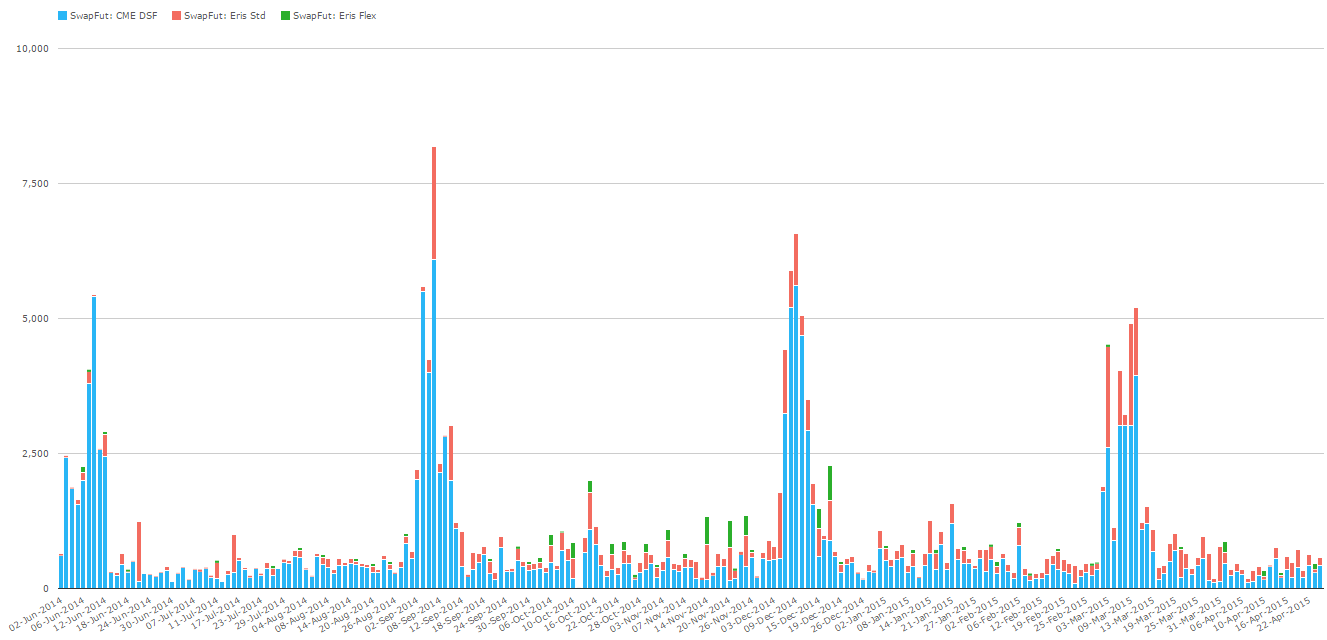
Staying on Swap Futures, we should look at the performance of each venue, which we believe is only the CME DSF contract and the Eris contracts, both of which are cleared at CME. Note that we’ve been checking on Eurex Swap futures which were launched last year, but there does not appear to be any activity yet.
Volume:
And now OI:
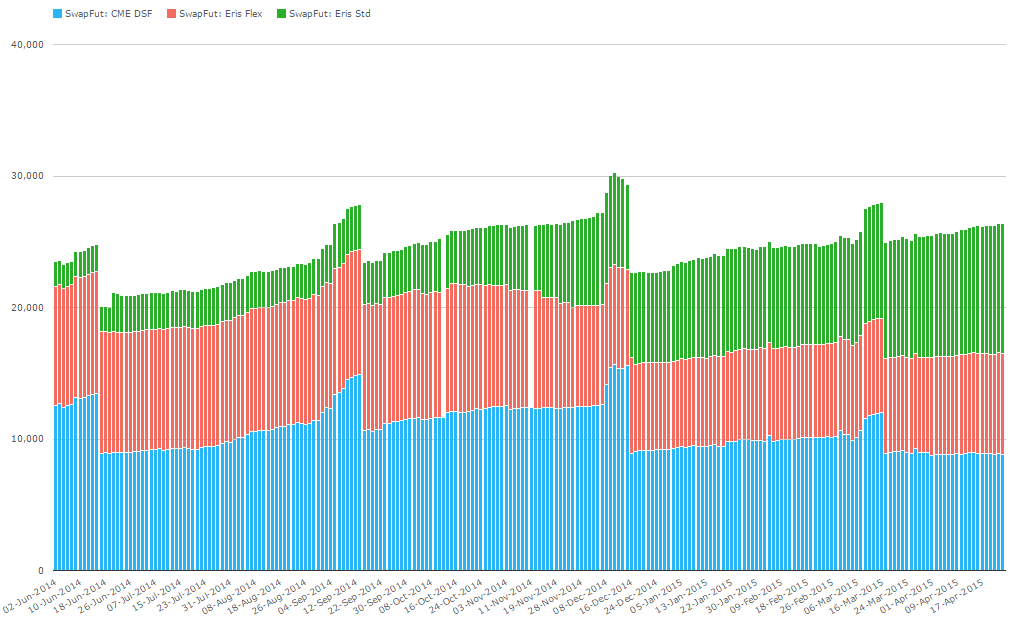
What strikes me here is a couple things:
- The daily volume of the CME DSF contracts seem to be larger than the Eris standards and flexes.
- However on an Open Interest analysis, Eris has significantly more (both the red and green lines)
- Of course because Flex contracts are bespoke like a real OTC contract, we’d expect this behavior of inflated OI (because no natural offsets emerge).
- So the true test of the venues when it comes to OI would be to strip out Eris Flex contracts (red)
- However even after we do that, the open interest of the Eris Standard Swap Futures (green) is now larger than the CME DSF (blue).
I cant quite explain the fact that DSF show more daily activity, but Eris Standard contracts show more OI. Alas I am out of time for today. Please send us your thoughts.