Following on from my prior article looking at Canadian Derivatives Reporting to SDRs, I thought I would look next at Australia.
The Australian Securities & Investments Commission (ASIC) Derivatives Transaction Reporting requirements began as follows:
- Phase 1 firms (Swap Dealers) in October 2013
- Phase 2 firms in April 2014 and October 2014
- Phase 3 firms in April 2015 and October 2015
OVERVIEW OF REQUIREMENTS
Key points:
- OTC Derivatives in Credit, Commodities, Equity, FX and Interest Rates (so excludes Exchange Traded)
- Australian entities must report to a Trade Repository Licensed by ASIC
- Currently DTCC Data Repository Singapore (DDRS) is the only ASIC licensed TR
- Licensed TRs must publish weekly statistical reports on a public website at no charge
- Non Australian entities subject to ASICs reporting, can report to prescribed TRs
- There are nine of these (DTCC US, UK, JP, SN and CME, INFX, ICE TV, MAS HK, Unavista)
Further details can be found on the ASIC website
PUBLIC DISSEMINATION OF TRANSACTION DATA
Regular readers of the Clarus Blog will know that transaction level public dissemination is the most interesting data as it includes information on both price, volume and time of execution.
The bad news is that ASIC does not require TRs to make transaction level public data available.
The ASIC rules state that statistical data is published and defines some breakdowns (asset class, currency, maturity, cleared or uncleared and volume by number and value and open positions). It also states that “the statistical data published under this Rule must not include Derivative Trade Data capable of identifying a counterparty to a Derivative Transaction”. (Full Rules can be found here).
So very different to the US and Canada; more similar to the current rules in Japan and Europe.
Lets take a look at What the Data Shows.
PUBLIC STATISTICAL DATA
The DTCC GTR-Australia website provides a link to Australia Public Data, as shown below.
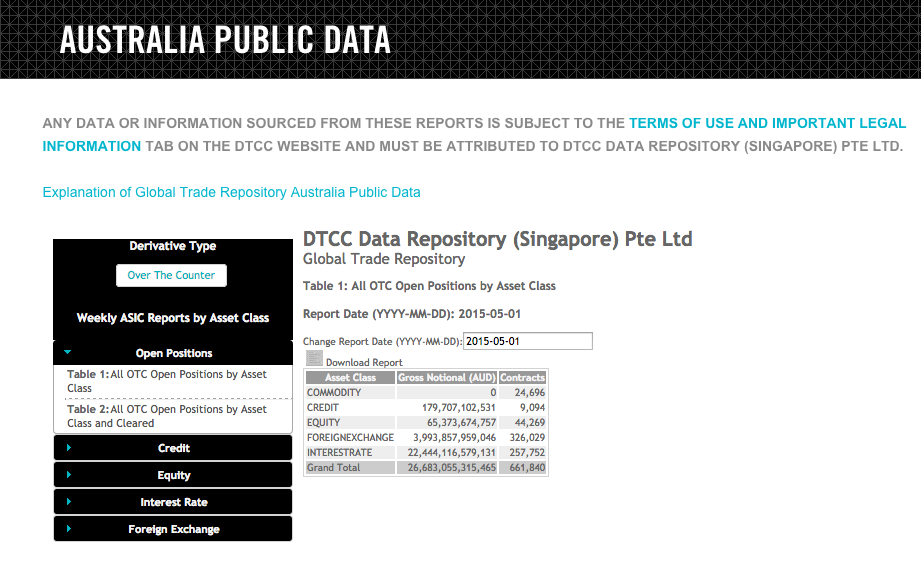
The most recent data today is as of May 1, 2015, so just over a week old, which suggests the data is published weekly with a weeks lag. There are 7 different reports, which are described in the Explanation document found on the above page.
The document also states that trade counts and notional are per trade and not per trade side. So single counted as in the US and Canada. It further states that if both parties to a trade independently submit their side of a given contract to DDRS, the GTR will pair the two sides based on the common id between the two submissions. This common ID may be either the Unique Trade Identifier (UTI), or Unique Swap Identifier (USI), or both. This position will be counted once for the purposes of volume and notional amount aggregation.
The trade population for all public reports will include only trades submitted to DDRS for Australian reporting.
Lets look at the detail.
Asset Class
Starting with Table 2, as this also contains the information given in Table 1.
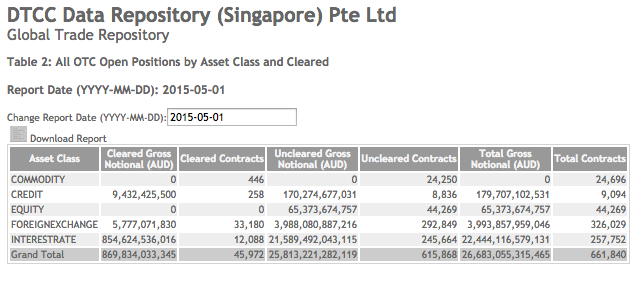
Showing that:
- Interest Rate is the largest Asset Class
- Interest Rate Cleared is 12,088 trades of AUD 855 billion gross notional
- Interest Rate Uncleared is 245,664 trades of AUD 21.6 trillion gross notional
- FX is the next largest Asset Class
- FX Cleared is 33,180 trades of AUD 5.8 billion gross notional (?)
- FX Uncleared is 292,849 trades of AUD 4.0 trillion gross notional
- Commodity, Credit and Equity are much smaller
- Commodity does not seem to have gross notional figures (?)
Weekly reports are available starting from Oct 31, 2014, so lets look at Table 2 for 1-month prior, April 3, 2015.
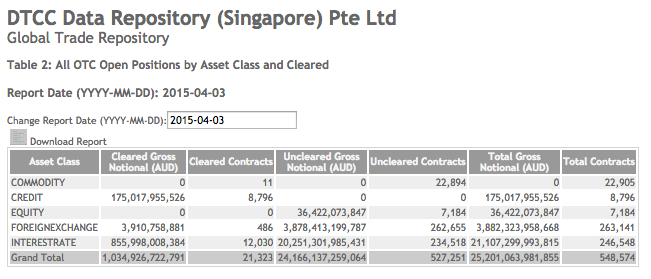
Comparing the two Tables allows us to determine the change in open positions, which should give us some idea of new trade volume, allowing for the fact that we do not know the number of maturing or terminated trades:
- Interest Rate Cleared shows an increase of 58 trades but a decrease of AUD 1.3 billion
- So in this case the number of maturing or terminated trades must be far greater than new, shedding no light on the latter
- Interest Rate Uncleared shows an increase of 11,146 trades or AUD 1.3 trillion
- FX Cleared shows an increase of 32,694 trades(?) and AUD 1.8 billion(?), which seem in-consistent with each other
- FX Uncleared an increase of 30,194 trades and AUD 109 billion, more reasonable
We can try and sanity check the Cleared volumes by comparing with what Clearing Houses publish.
Starting with the AUD 855 billion of Cleared IRS on May 1.
Lets use CCPView to look just at Open Interest in Interest Rates for AUD trades, on the assumption that the vast majority of this AUD 855 billion is for AUD positions.
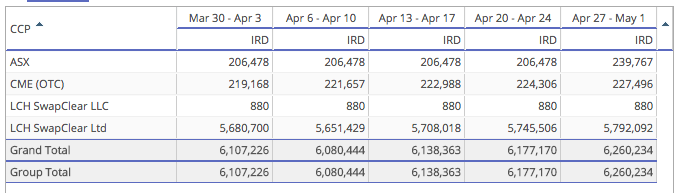
Showing that:
- ASX has AUD 240 billion, the majority of which should be in the AUD 855 billion number
- LCH SwapClear Ltd has AUD 5.8 trillion and we know that some Australian firms use SwapClear
- LCH SwapClear Ltd AUD number is likely to be dominated by Global Swap Dealers and not Australian firms
- Surprisingly CME also has a similar amount to ASX
Given these figures the AUD 855 billion would seem reasonable.
What about the AUD 5.8 billion of FX?
CCPView for all Currency Pairs shows:
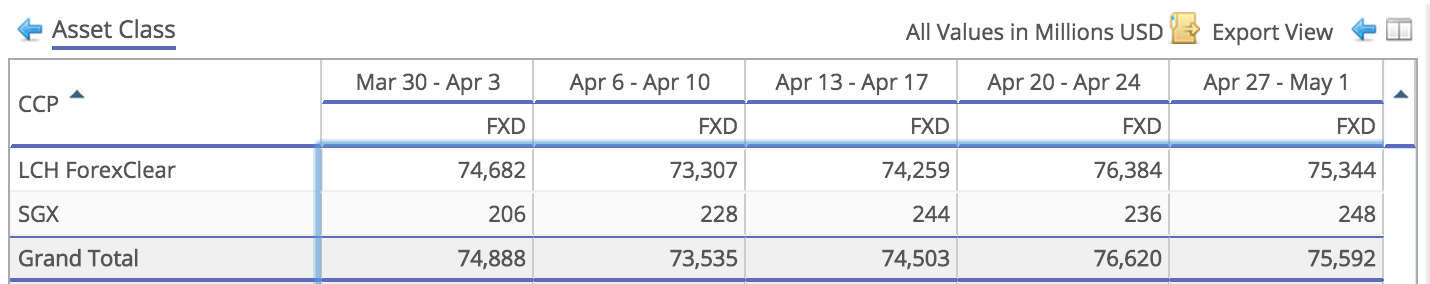
An Open Interest of $75.6 billion, meaning that the AUD 5.8 billion is reasonable. However we would want to see the currency pair breakdown to be comfortable.
Lets now look at some of the Asset Class specific reports.
Credit
Starting with Credit, for which there is one report, Table 3:
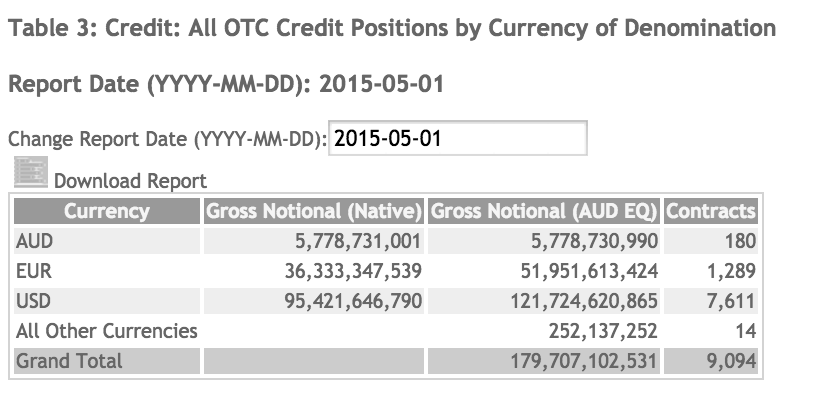
Unfortunately no breakdown between Index and Single Name. However we do have a currency breakdown with USD the largest at $95 billion. From Table 2 we know that there is no Uncleared volume in Credit, so it is worth looking at the Global Cleared Open Interest in CCPView for USD trades. This shows $849 billion on May 1, meaning that the $95 billion represents 11%, perhaps higher then we would expect but plausible.
Not much else to look at, unless we want to investigate the change in positions over prior weeks.
Interest Rates
Interest Rates has two reports, one for single currency and the other for cross currency.
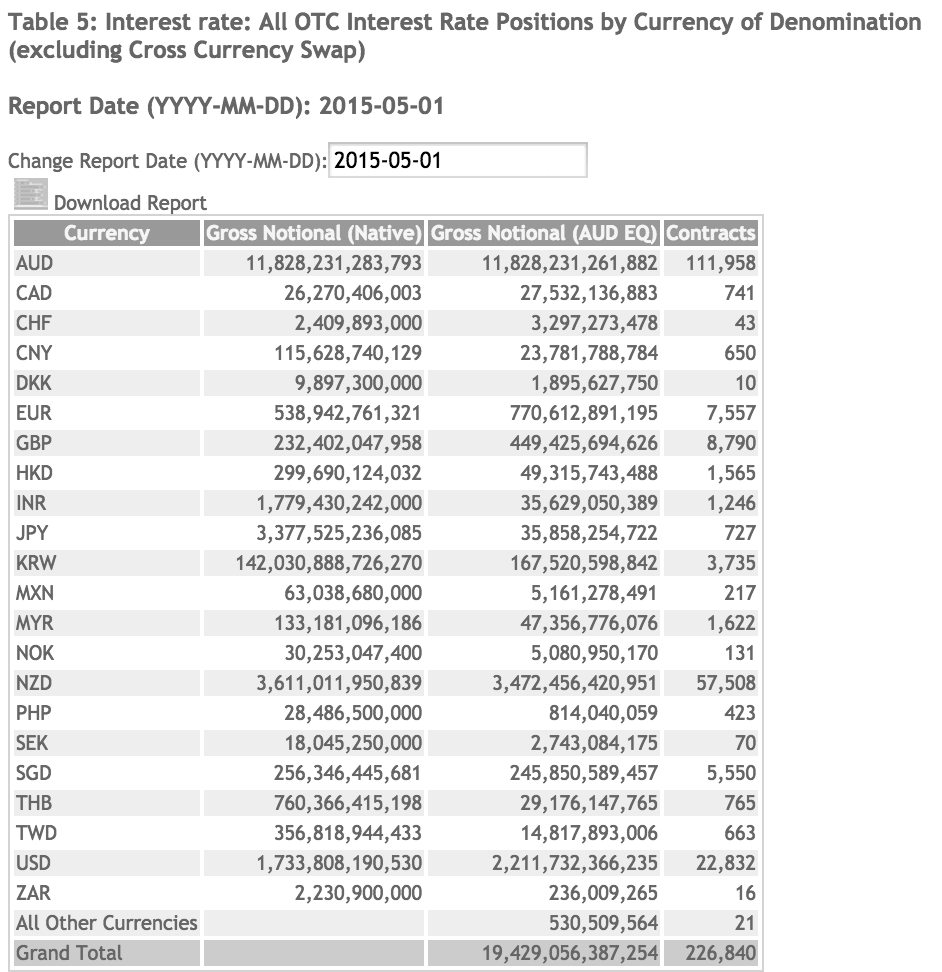
Which shows that:
- AUD trades are AUD 11.8 trillion and represent 61% of the total
- There is no Cleared vs UnCleared Breakdown
- So we are unable to verify our assumption in the Asset Class section that AUD 855 billion comes largely AUD trades
- There is no Product breakdown
- It would have been useful to have the FRA, IRS, OIS, Swaption split
- There is no Maturity breakdown
- NZD trades are AUD 3.5 trillion and represent 18% of the total
- USD trades are AUD 2.2 trillion and represent 11% of the total
- All other currencies represent 10% of the total
Next lets look at Table 6 for Cross Currency, but presented as a pie chart as the table has too many pairs including the inverses shown separately:
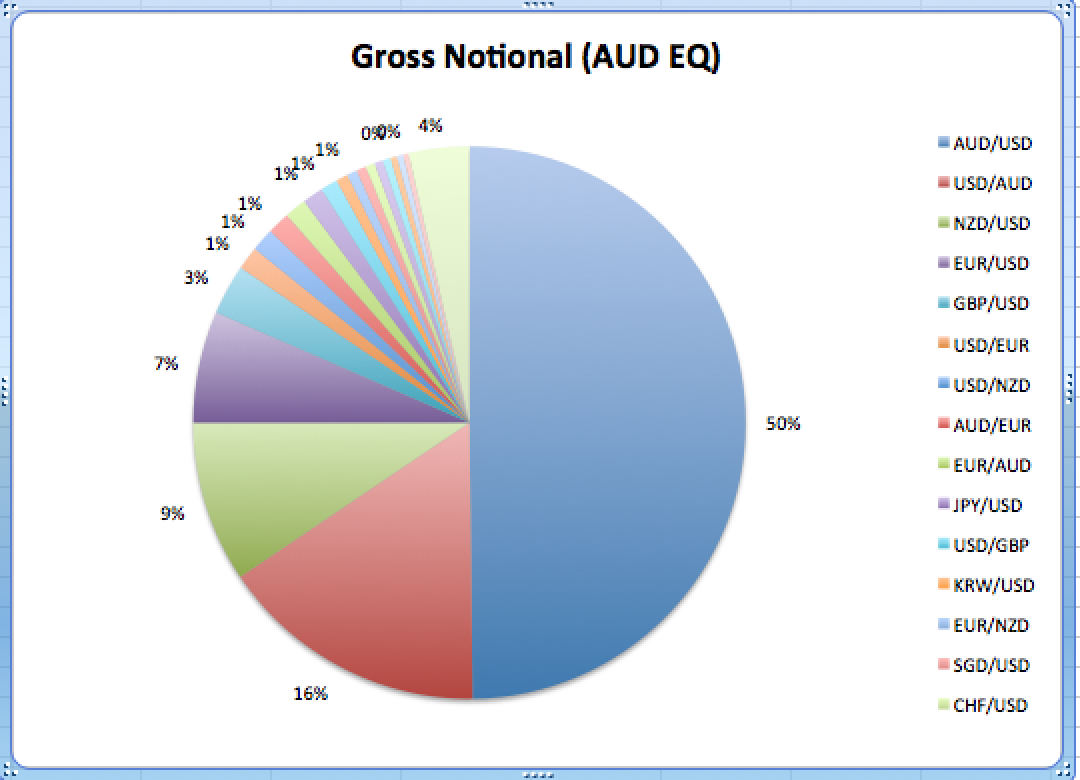
Showing that:
- AUD/USD is 66% (50+16) of the Open Interest
- NZD/USD next at 10%
- EUR/USD is 8%
- GBP/USD is 3%
- Rest are 13%
Foreign Exchange
Table 7 for FX has even more currency pairs and all the inverses too. Why cannot firms report side 1 and side 2 according to the convention for the currency pair? Or why can the TR itself not sort this out. Just creates the same work for everyone looking at this data, including myself :-).
So another download to Excel and massaging numbers to get a pie chart:
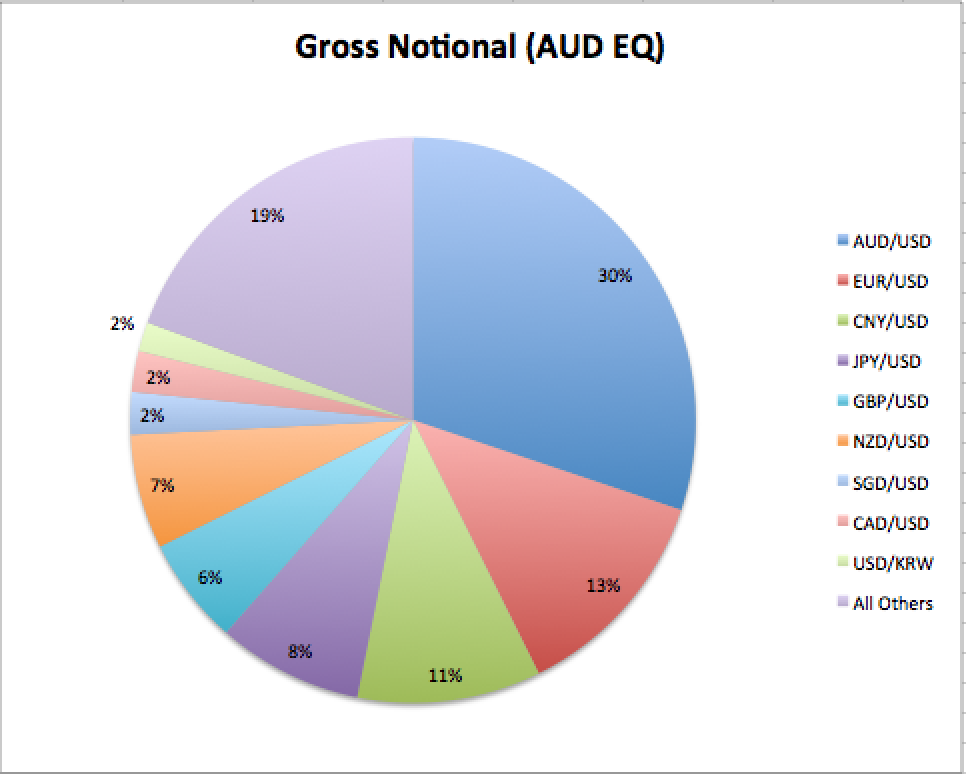
Presumably the major currencies are predominately FX Options, while the CNY and KRW are NDF and FX Options.
Thats all I have time for.
SUMMARY
The DTCC GTR Trade Repository is live in Australia.
Dealers have been reporting since October 2013 and Phase 3 firms will do so by October 2015.
There is no requirement for transaction level public dissemination.
Weekly statistical public reports have been published since Oct 31, 2014.
These show that a large number of trades and gross notional is reported each week.
The reports lack some useful dimensions like product or maturity.
But nonetheless show a tantalising glimpse into Australian OTC Derivatives Data.
Just a shame that Australia has not followed the US example and decided to require transaction level public dissemination.
Which would have been far more useful in improving transparency.
A missed opportunity.