- We use price and volume data to measure the “surprise factor” of the Fed’s rate hike last week
- OIS volumes were impressive, near to the highest day all year…
- …with evidence of a preference towards cash-settling derivative trades
- We suggest different ways of using the volume data to measure the degree of surprise in the market
- The ultimate goal is a Clarus Fed Surprise Indicator!
Lift-Off
Seeing as the Fed (finally) gave the savers of the World a Christmas present in the way of lift-off, I thought I’d do a bit of fun analysis to see if we could tell, simply from the data, how well markets had anticipated the move. We’ll look at both price and volume data, and aim to present a structure that can be expanded upon as the Fed continues along their rate-hike path.
Price Data
I was a bit surprised and, truth be told, disappointed, to see a hodge-podge of prices when I looked at the OIS price action in SDRView Pro for the days around the Fed meeting on Wednesday 16th:
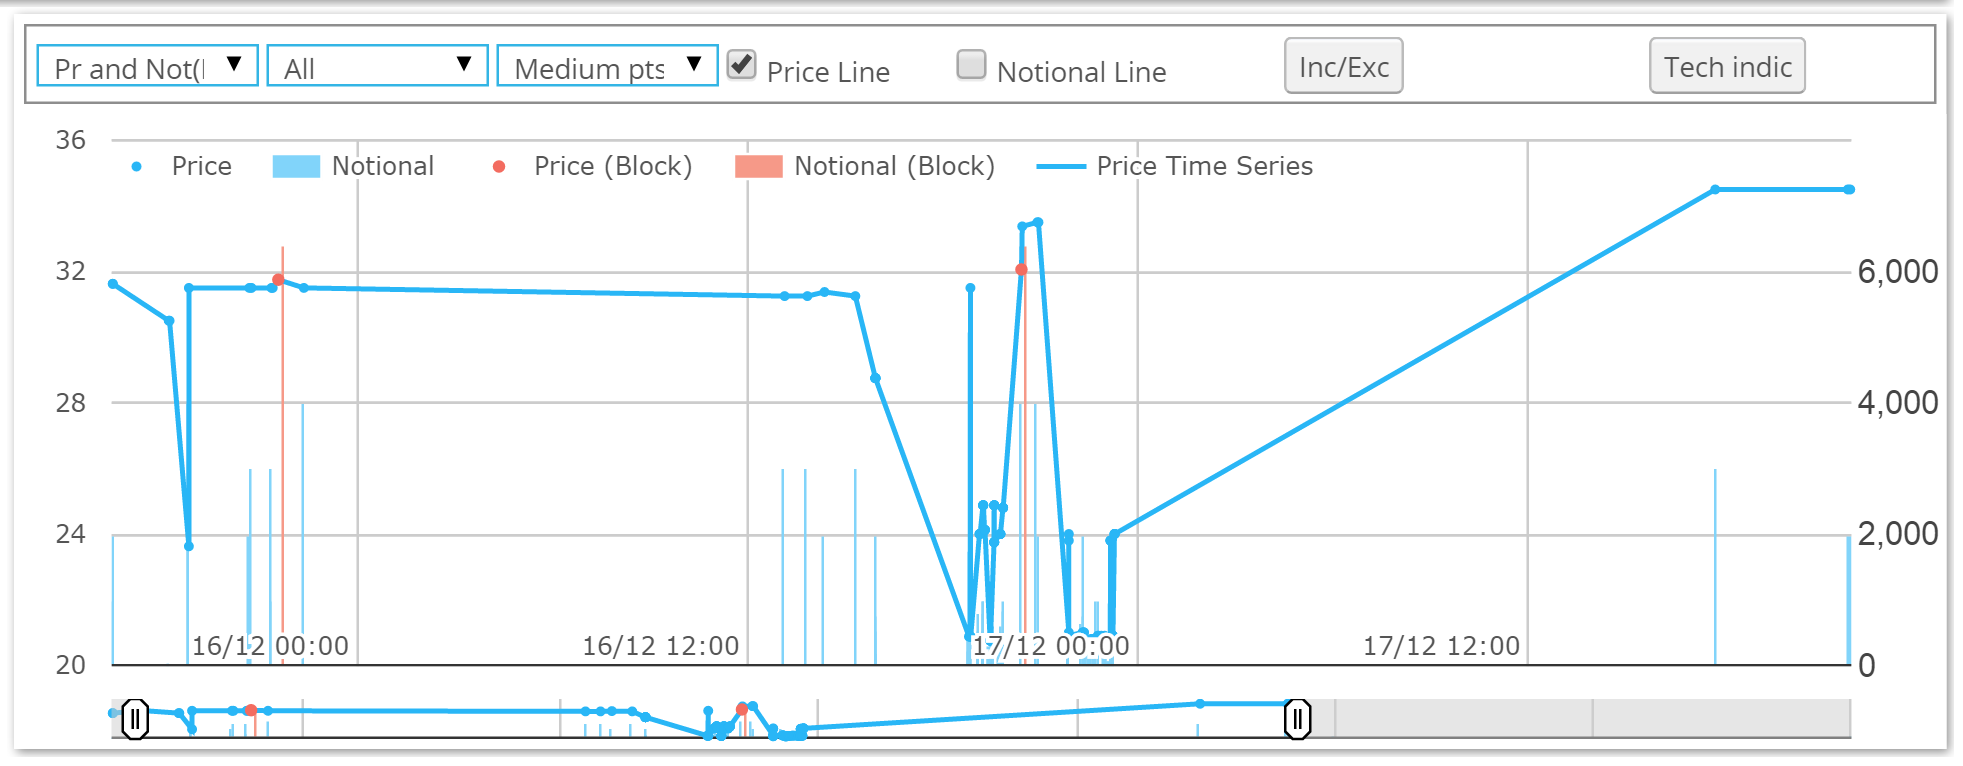
And the numbers put it even more starkly;

For 1 month OIS structures trading in the week of the Fed, we apparently had:
- A high of 34.5 basis points
- A low of 20.6 basis points
- Across a large number of trades – 122 in total across SEF and non-SEF venues.
- And the chart shows that those headline rates are not just occasional trades – there are frequent jumps in the rates traded.
This struck me as odd, as the Fed hike was pretty well telegraphed – as we have come to expect from Central Banks with their focus on transparency these days. Was it simply bad data?
It’s almost never bad data these days!
In the early days of SDR reporting, yes, we may have been seeing bad data. But these days, particularly for vanilla instruments like these, it is far more likely to be down to bad interpretation of the data that we are seeing, rather than the source itself. And this is indeed the case.
The vast majority of the trades have the same dates, running from the December Fed meeting to the next meeting on January 27th 2016. But when I export the trades to Excel, I can see that almost all trades have some kind of fee attached to them.
Fortunately, the primary economic terms of the trade allow us to calculate the DV01 of the trade. We can therefore convert these upfront fees into basis points and adjust the headline coupon on the trade accordingly. This gives us the following time-series of data:
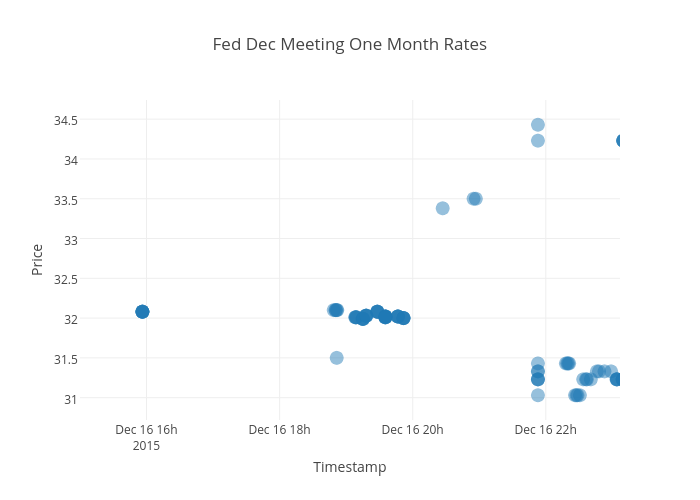
- A lot of traders choosing to unwind the Dec meeting trades rather than take them into delivery.
- Pre-meeting, there was a cluster of trading at 32 basis points.
- Post-rate hike, the meeting actually seemed to settle slightly lower than this at between 31 and 31.5 basis points.
- There were, however, also a number of trades done immediately post meeting at prices over 34 basis points.
If we therefore take the pre-meeting price of 32 basis points as the market expectation, we could say that the maximum “surprise” factor from the Fed was only up to 2.5 basis points. And during the press conference this gradually settled down to be around 0.5 basis point. At 2.5 basis points, converting to the CME Fedwatch lingo, that would mean that the market had priced-in just a 10% chance that they didn’t hike.
The reality is that the market was pretty much spot on and for those traders that didn’t insist on trading pre-press conference, there will have been very little PnL volatility for these positions.
But what about volumes?
Does a Fed surprise lead to greater volumes than usual – due to increased hedging activity and more speculative position adjustments? We can see this seems to be the case when we look at weekly USD OIS volumes over the last six months of 2015:
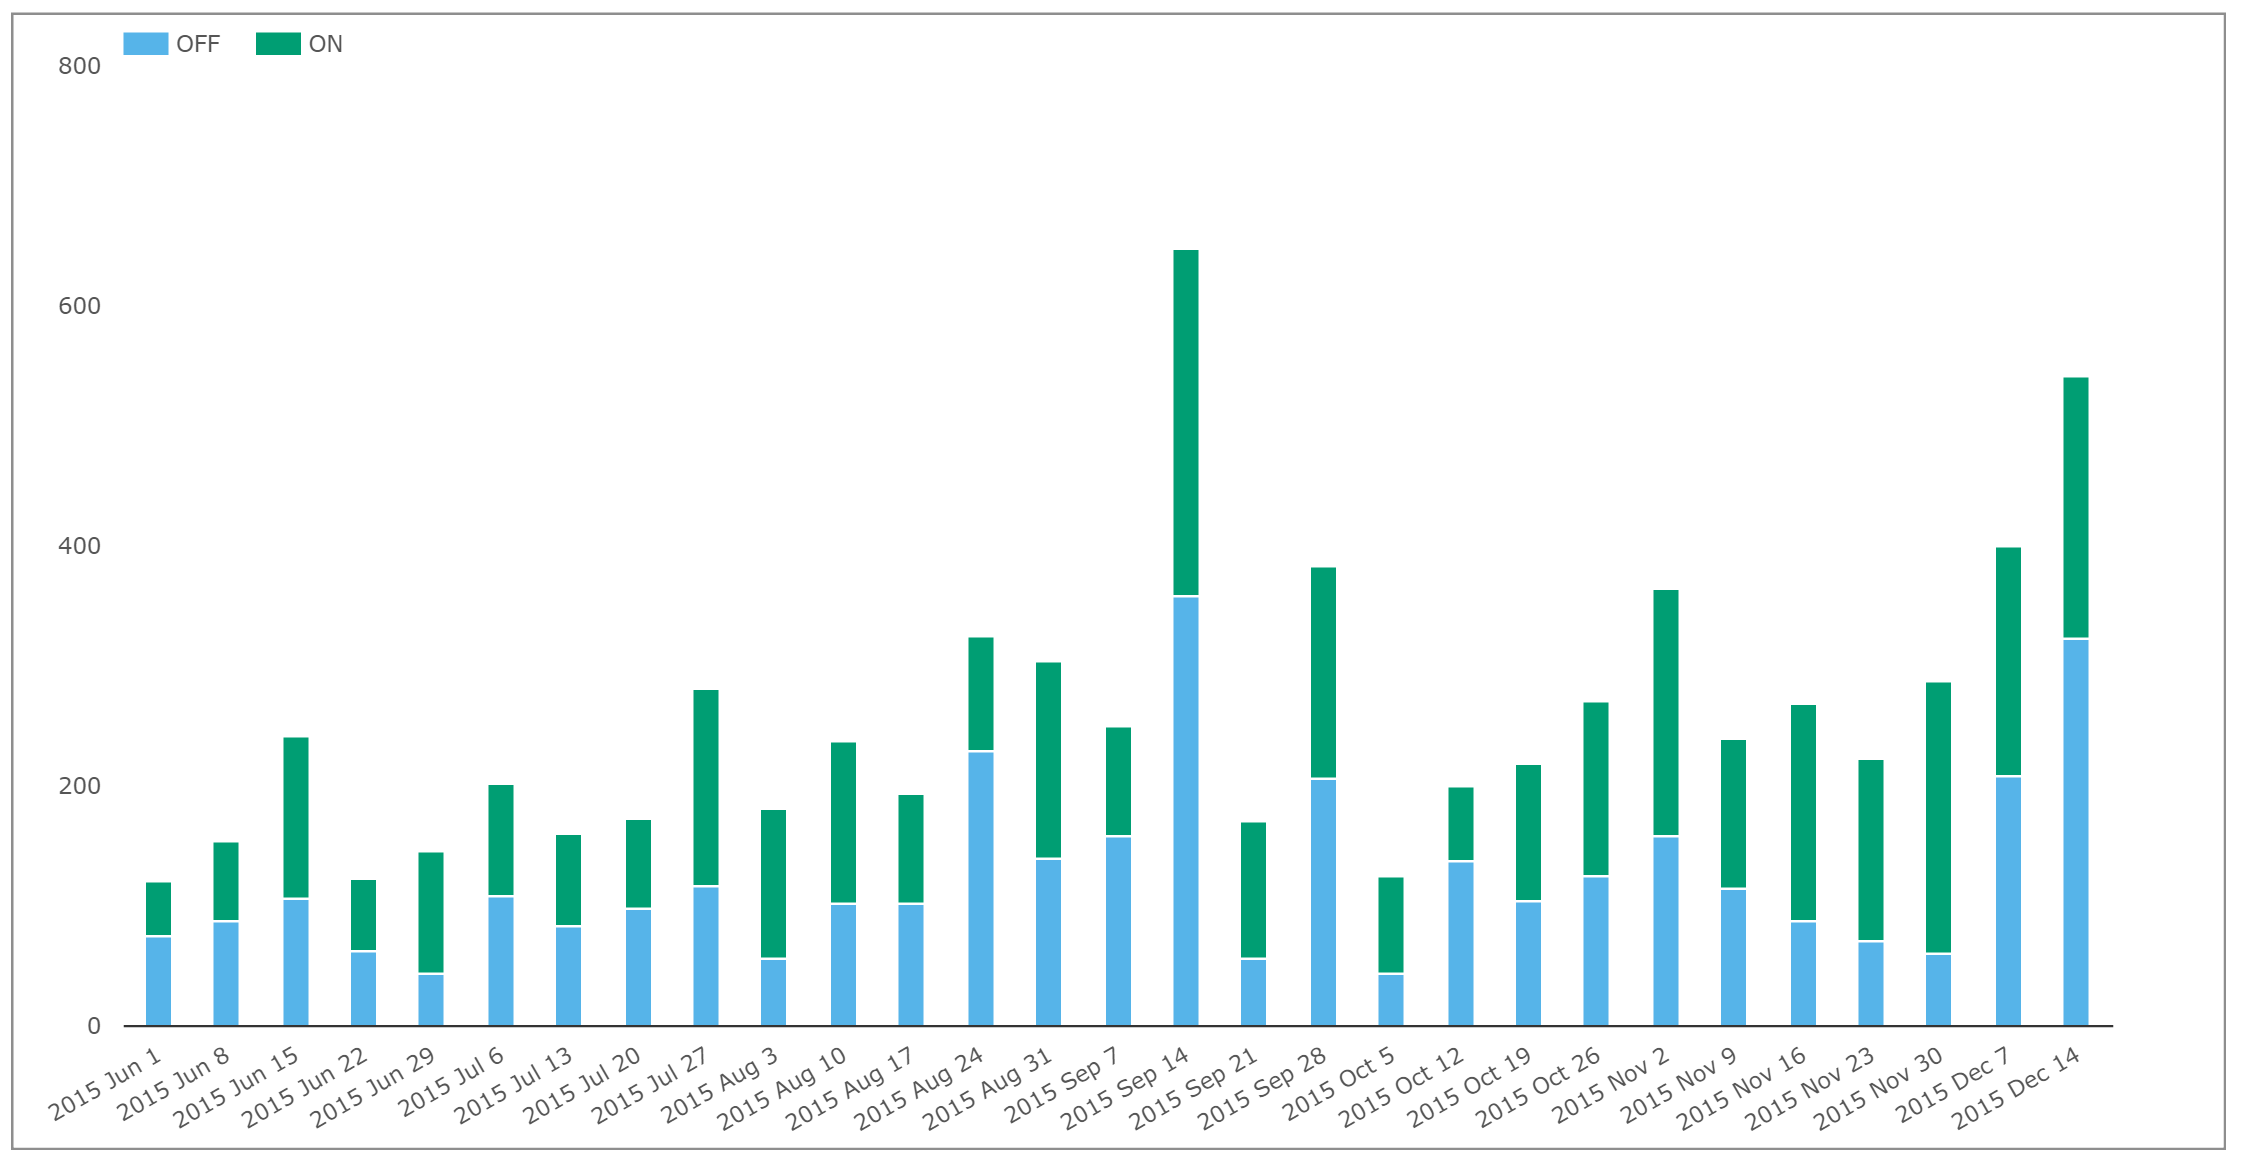
Showing;
- A spike in Volumes during the week of September 14th as the Fed was widely seen as “balanced” going into the meeting and did not hike.
- No discernible impact on volumes for the October meeting that passed without too much fuss.
- Decent volumes last week as the Fed finally pulled the trigger, but not as large as the September no-show.
It’s interesting to note that these volume spikes have all been in the week of the Fed meeting itself – suggesting the market is reactionary to the decision.
What happened last week? We can use SDRView Pro to get a good overview of OIS trading before, on and after the Fed meeting date:
Before the Fed Hiked

Showing, for USD OIS trading;
- A total of 149 trades across two trading days
- Accounting for a total notional of $264.6bn
After the Fed Hiked
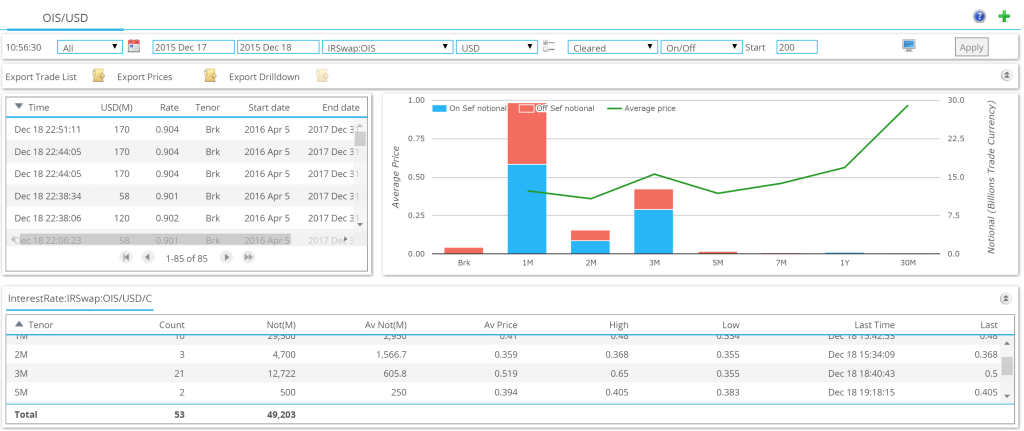
- After the hike, we saw just 53 trades across two days, amounting to only $49bn.
On the Fed Day
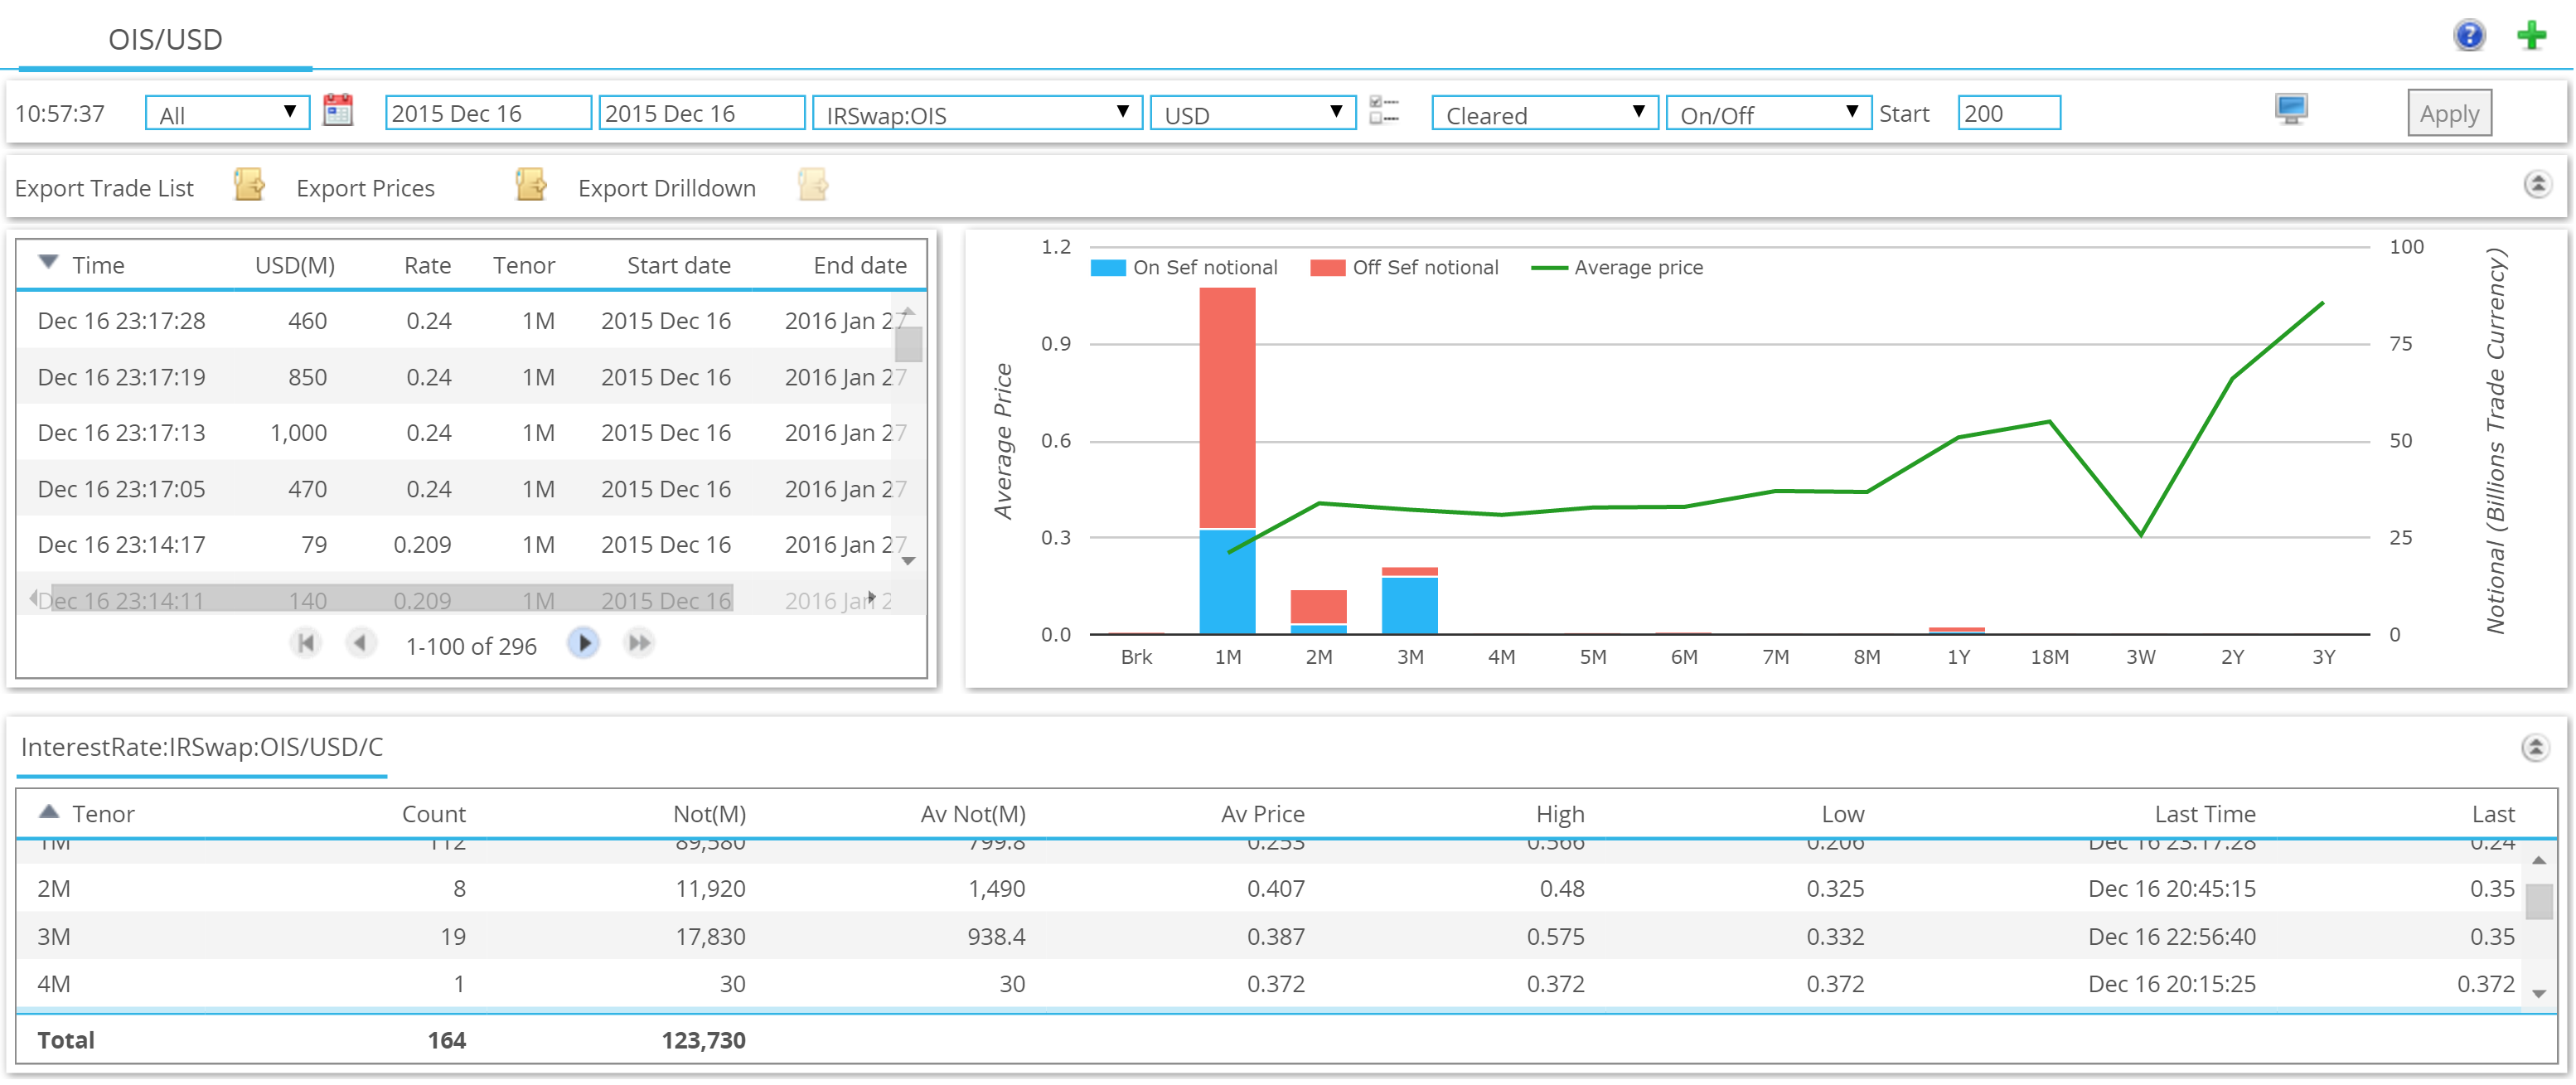
- Whilst on the Fed day itself, there was a lot of activity
- 164 trades in total, although the sizes were smaller overall, accounting for $123.7bn.
What do these volumes tell us?
Generally speaking, we are not surprised to see a spike in activity levels on Fed Day. If you got the call right, it makes sense to unwind your position and free up that capital. Or to cut losses!
Equally, the hedge may have served its purpose with the mark-to-market changes since it was put on – so there is no need to take the trade into delivery. This certainly seems to be the case for a lot of market participants. It was a popular choice on Wednesday last week to choose to cash-settle the Dec meeting OIS trades rather than realise the actual variability in the daily fed fund fixings over the next six weeks.
What we need to do is create some kind of baseline to see whether a spike in activity on a Fed day is associated with a “surprise” action by the Fed, or is simply natural position adjustments that always occur on these days. So let’s look at the average daily OIS volumes and try to ascertain what a “no surprise” day looks like:
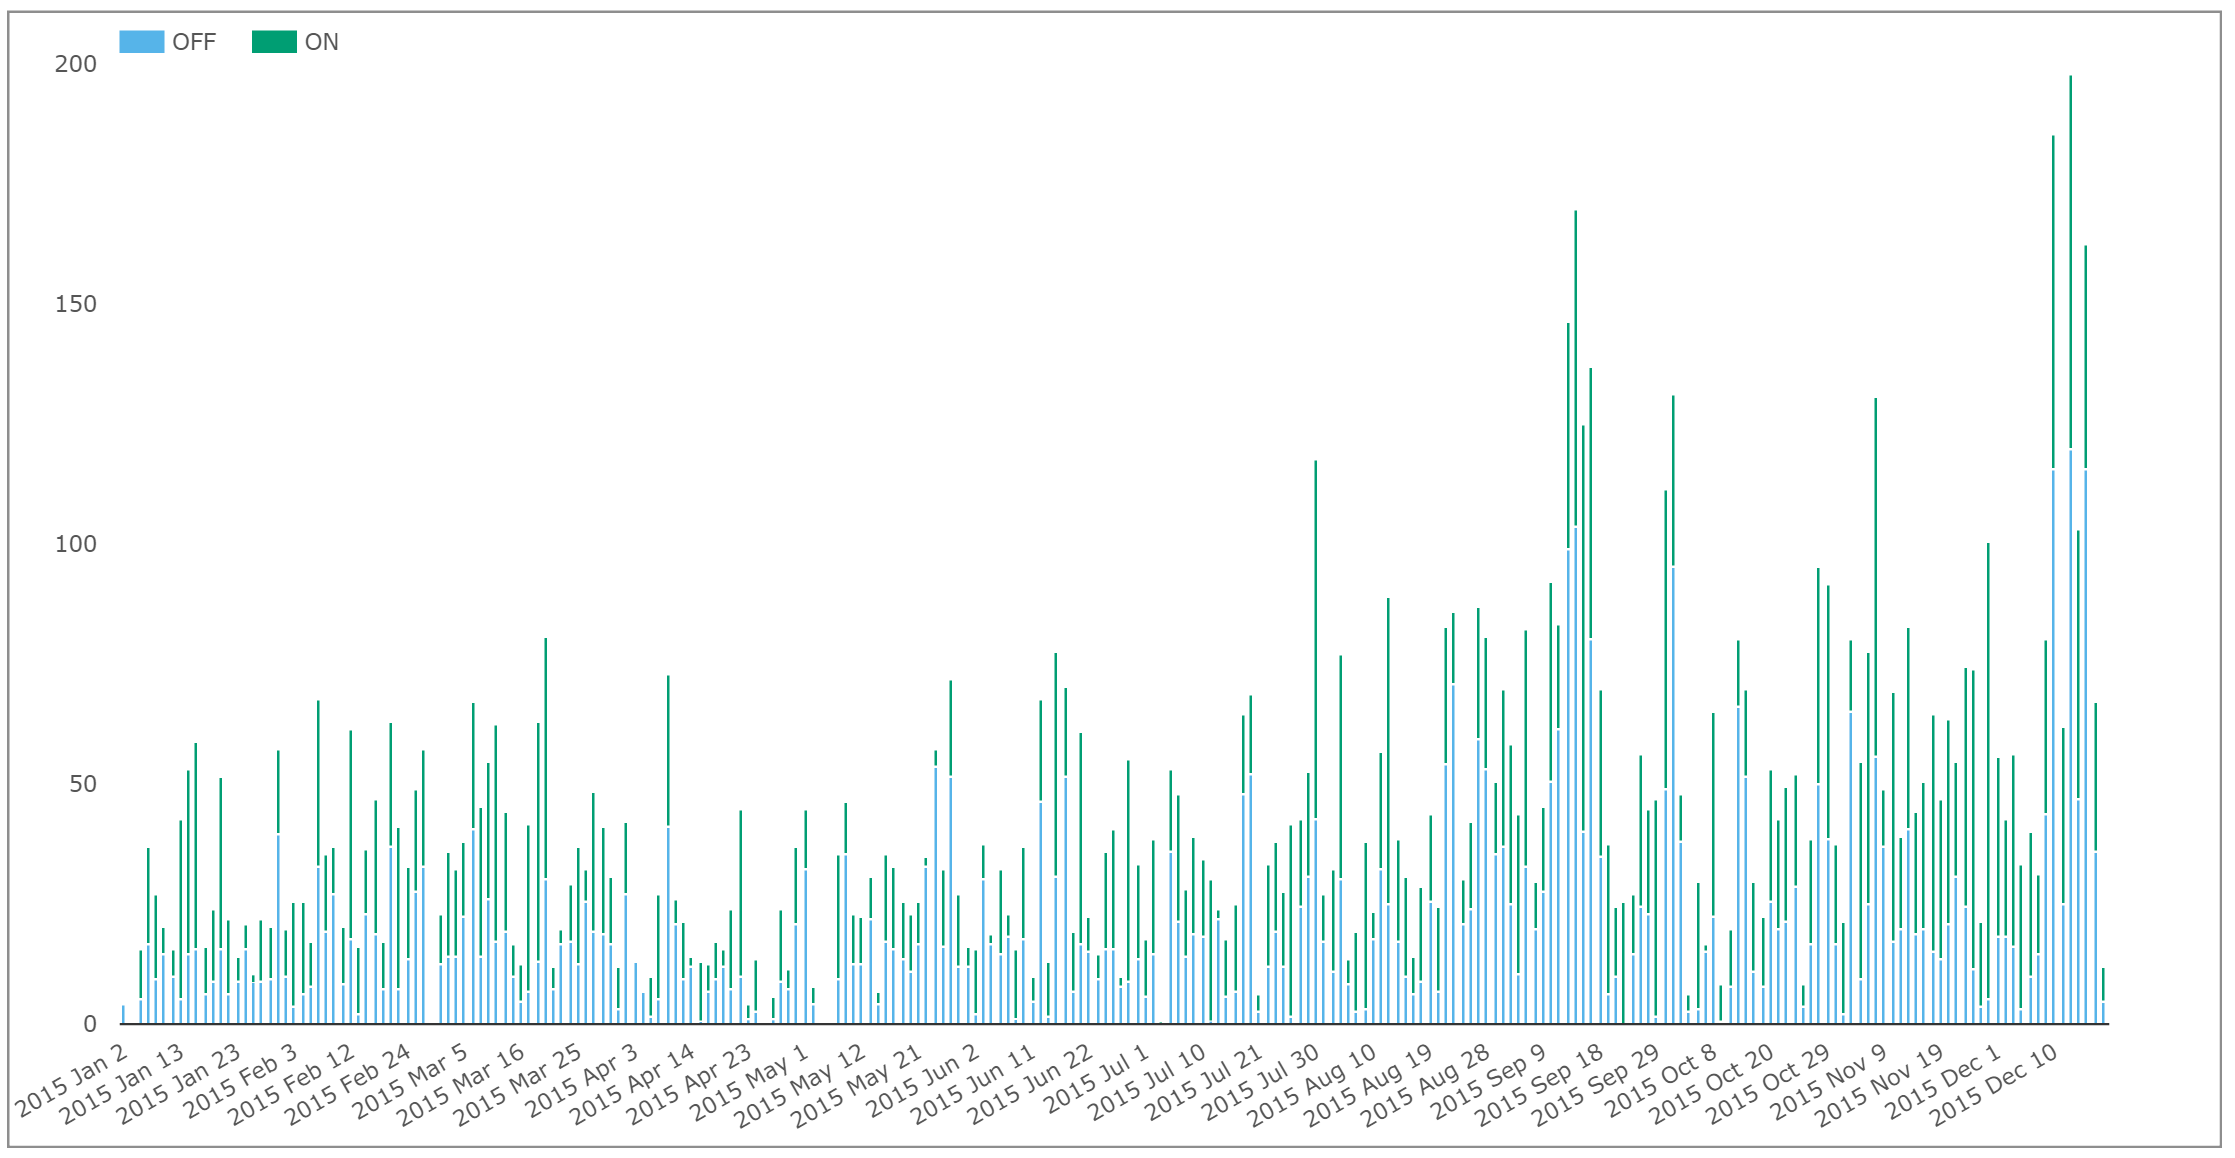
Showing;
- Daily USD OIS volumes throughout 2015
- Exporting this data reveals the following:
- An average daily volume of $43.1bn
- On the 2015 Fed meeting dates, this ADV increases to $76.7bn
- Therefore ADV excluding Fed dates is lower at $42bn
Ascertaining a “baseline” for a Fed day is not a moments work then. We can already see from the chart that OIS activity has been gradually trending higher throughout 2015, even on non-Fed days. But we have to start somewhere.
Therefore, let’s first exclude the last meeting date, plus the “surprise” no-show in September. That tells us to “expect” a notional amount of $52bn on a Fed day (i.e. the ADV of the 6 Fed meetings this year that went as expected). On this basis, the actual rate hike in Dec caused 310% more market activity than expected ($162bn in daily volume)!
Okay, so let’s take this one step further. We know that activity has been trending up through the year, and that we probably learn just as much about the next meeting as we do about the decision made in that day’s meeting. So we’re going to test the following concept:
Clarus Fed Surprise Index – Daily Volume of OIS traded on a Fed meeting date versus the Average Daily Volume of OIS traded between the meeting dates.
This gives us the following time-series for 2015:
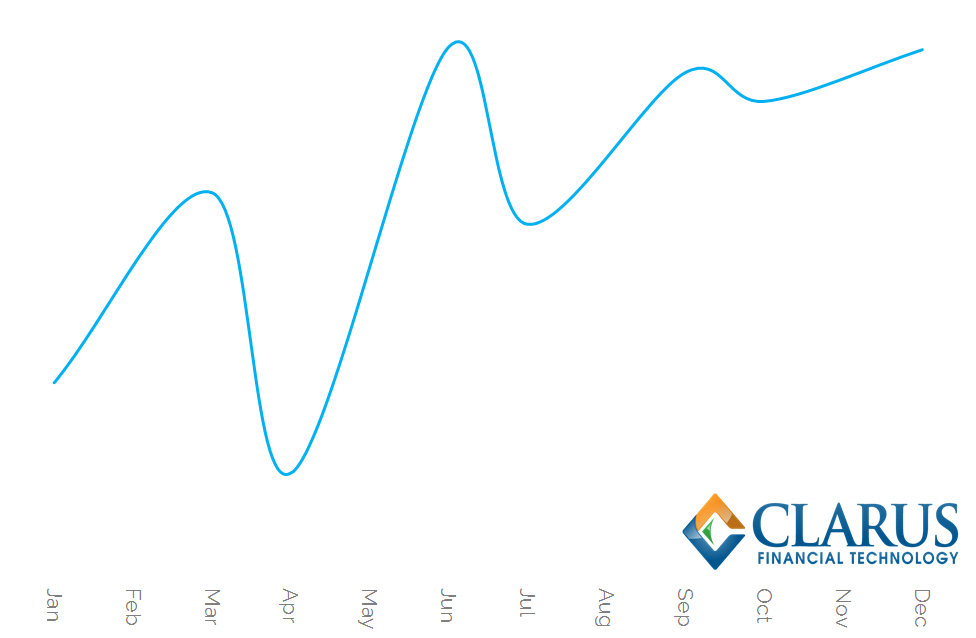
Showing:
- The lowest levels in the first half of this year as the Fed was fairly clear in its’ intentions not to change policy (one way or another at times!).
- Beginning to peak in the Summer months – which could have been caused by general global volatility, plus the thought that the Fed was increasingly “in play”.
- Unfortunately for the Index credibility, it failed to peak in September, which is a bit of a shame as this was the biggest “surprise” of the year, with the Fed more dovish than expected.
- It appears that we really need to do some relative scaling on this index – because as volumes have generally increased this year, it has also led to more trading on the actual Fed day – even relative to the days running up to the meeting.
So, a work in progress…
It would be foolish to present the finished article in the days running up to Christmas….the message is somewhat diluted when 75% of your readership is out of the office!
So consider this an introduction to what will be a work in progress in early 2016. The concept is simple – we build-up ever more data history over what typical investor behaviour is like across a number of Fed meeting dates. We can then increasingly benchmark the surprise level of subsequent Fed decisions.
And then, of course, we can look at the predictive properties of this data-set for the next decision. That is always the holy grail – but we are not there yet.
Finally
Seasons greetings to all, and many thanks for your loyal readership throughout 2015.
We at Clarus are all looking forward to 2016 with a lot of excitement to see what the markets will bring.