In January 2016, the Basel Committee on Banking Supervision (BCBS) published its Standards for Minimum Capital Requirements for Market Risk; also known as the Fundamental Review of the Trading Book (FRTB). These new standards replace parts of the Basel 2.5 reforms, which were introduced in 2009 to address the material undercapitalisation of trading book exposures during the 2007-08 financial crisis.
In this article, I will look at What You Need to Know.
Lets start with accounting.
Boundary of Trading & Banking Book
Positions marked as being held to maturity are defined for regulatory purposes to be in the banking book, while position’s that are tradable are defined for regulatory purposes to be in the trading book. It stands to reason then that trading book positions are subject to mark to market and so attract higher market risk capital charges.
To reduce incentives for arbitrage between banking and trading book treatment, the definition of the trading book is supplemented with a list of instruments presumed to be in the trading book unless explicit supervisory approval is received for any deviations.
In addition strict limits on the movement of instruments between banking and trading books is introduced.
Moving onto the more interesting model aspects.
Standard or Internal Model Approach
As before either a Standard Approach (SA) or an Internal Model Approach (IMA) may be used, but instead of being agreed at a bank-wide level, a bank supervisor can approve or remove the use of an Internal Model approach (IMA) at a trading desk level.
For IMA approval a trading desk must meet two quantitative criteria:
- P&L Attribution, a test to determine if P&L based on risk factors used by the desks risk management model captures the material drivers of Actual P&L
- Backtesting, a test to determine how well the risks in an internal model are captured
A supervisor can withdraw IMA for a trading desk, meaning that both SA and IMA results need to be calculated on a daily basis.
Lets look at the revisions to each of these approaches.
Internal Model Approach
Under Basel II, most firms IMA was based on a Value-at-Risk approach using a 10-day liquidity horizon, 99% confidence level and varying historical periods (>2Y) and an additional Stressed VaR component.
The revised IMA approach requires the following:
- Expected Shortfall (ES) measure, which better captures tail risk, replaces VaR and Stressed VaR
- Liquidity Horizon is made variable from 10-day to 120-day depending on the instrument
- ES must be calibrated to a period of significant financial market stress
- Constraints on portfolio diversification benefits
Lets use an example to illustrate the impact of using ES instead of VaR.
Expected Shortfall
A histogram showing the possible PLs for our trading desk using 4 years (1043 observations) of returns.
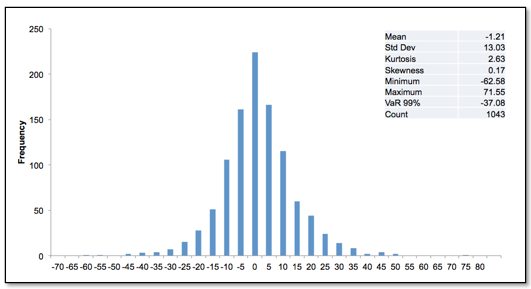
If we now zoom into the left-hand Loss tail:
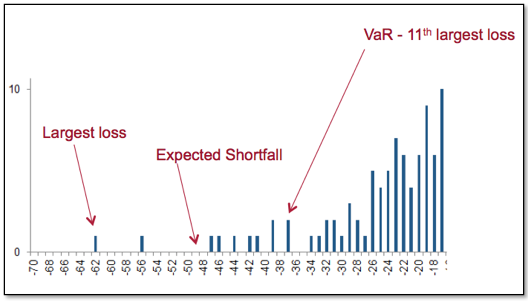
We see that:
- VaR at 99% is the 11th largest loss and is $37 million
- The worst case largest loss is $62.6 million
- ES is between these two and is $48 million
So rather than using VaR and saying we think that on average the portfolio would lose more than $37 million in 1 out of 100 days and not knowing whether that more than means $37.1 million or $100 million, we use ES and say that on average in 1 out of 100 days that our portfolio has large losses, we expect this loss to be $48 million.
Given the long-tailed nature of financial time-series data, we can expect the use of ES to result in a better measure of tail risk.
Liquidity Horizon
Under Basel II, firms either used 10-day returns to calculate VaR or scale a 1-day VaR to 10-days.
The revised FRTB rules require ES to be calculated using a base liquidity horizon of 10-days and this ES to be scaled by mapping each risk factor to one of the risk categories below.
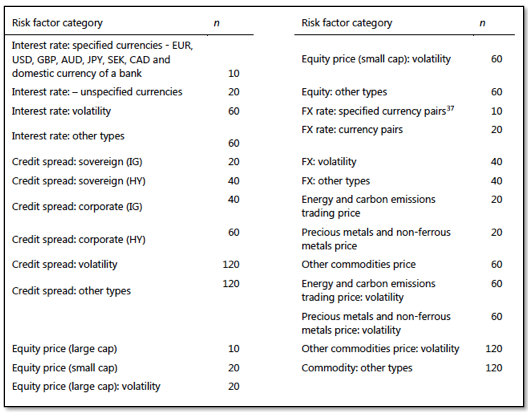
Meaning that a portfolio of:
- Minor currencies will have an ES of sqrt(20/10) or 1.41 times higher
- Credit spread corporates (IG) will have an ES of sqrt(40/10) or 2 times higher
- Interest rate options will have an ES of 2.45 times higher
- Credit Spread volatility products will have an ES of 3.46 times higher
These reflect the increased time to liquidate such positions in a time of market stress, resulting in a higher potential market loss.
Diversification Benefits
It is well known that in times of market stress, correlation’s between markets and risk factors may become un-stable, consequently the revised rules require ES to be calculated as an equal-weighted average of a diversified ES and an non-diversified ES, calculated as the sum of partial ES results per risk class (IR, EQ, FX, CM, CR).
Overview of Internal Model Approach
A useful chart from the BCBS 352 document.
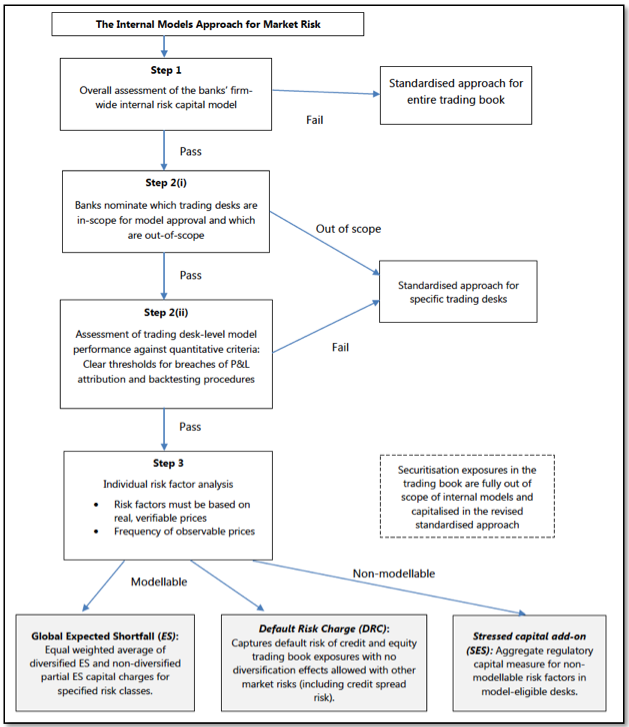
Which is self-explanatory and also introduces the Default Risk Charge, the AddOn for Non-modellable factors and the fact that Securitisation exposures must use the SA. (All topics for another day.)
Lets now move on from the Internal Model Approach.
Standard Approach
The direction of travel in regulation is away from internal model approaches and towards standard approaches.
As such the new Standard Approach (SA) has been significantly revised and utilises a risk sensitivities as inputs into capital calculations. As risk sensitivities are crucial to the pricing and risk management models of trading firms, a standard approach that utilises these has to be better than one that does not.
And a useful chart from the BCBS 352 document.
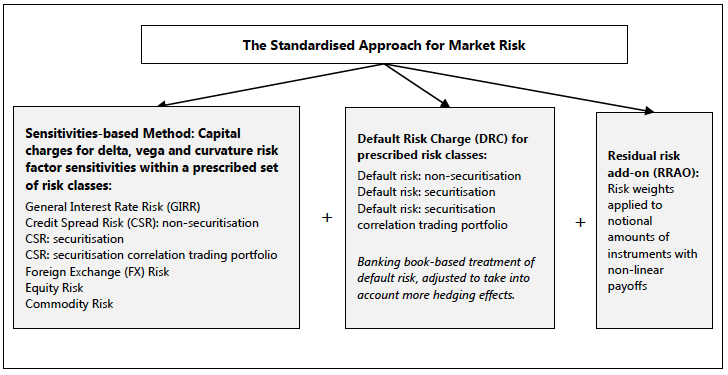
Sensitivities-based Method
The approach may be summarised as follows:
- Delta, vega and curvature sensitivities need to be calculated by mapping instruments to a set of regulatory risk factors to which shocks are applied
- The weighted sensitivities are aggregated within each bucket using prescribed correlations and an aggregation formula
- The resulting bucket-level capital charges are aggregated to determine a risk class level charge
- The aggregate charge is the simple sum of each risk-class charge
Of-course there is a lot of devil in the detail, but while the mind is willing the flesh is weak or is it the other way around? So I will leave that to another day and for those of you that cannot wait, please see the BCBS 352 document.
Impact Analysis
Before we end lets look at the BCBS Quantitative Impact Study (QIS) results.
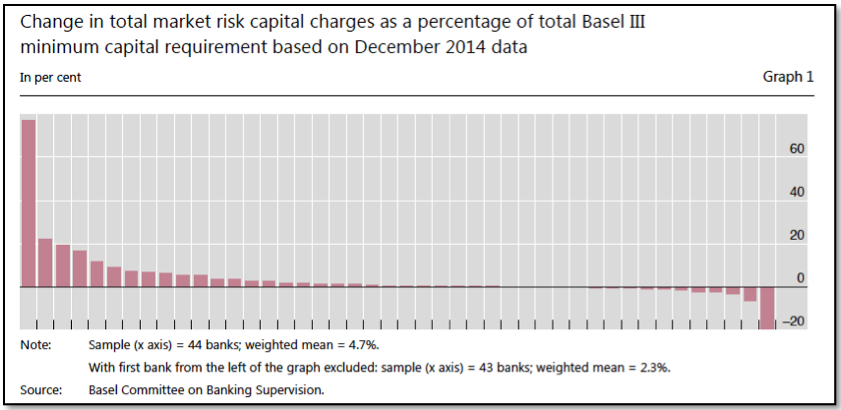
Showing that:
- There is a lot of variance between the 44 banks
- The increase on average is 4.7% of the overall Basel III capital requirement
- As Market-risk Risk Weighted Assets (RWAs) account for 10% of Total RWAs up from 6%
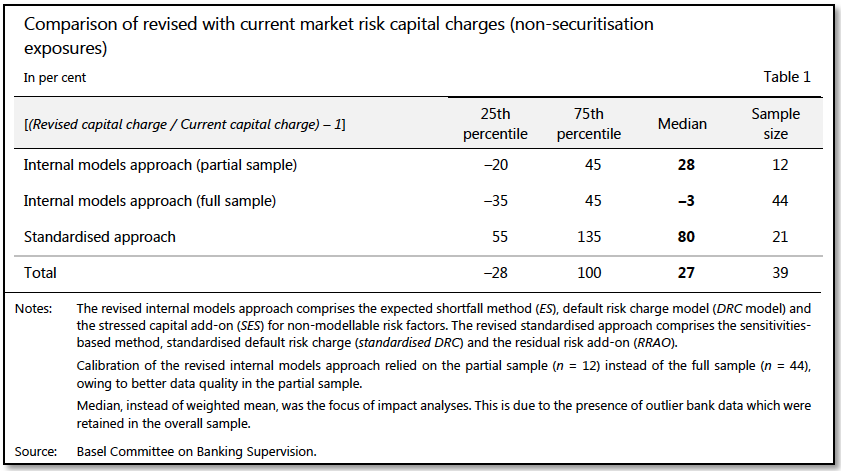
Showing:
- A Median increase of 27% in the Market Risk Capital Charge
- Under IMA comparing before and after shows +28% for 12 banks with large trading books
- While IMA before and after shows a 3% drop for the full sample of 44 banks
- The Standard Approach shows an 80% increase comparing before and after
Final Thoughts
FRTB is expected to be adopted by each jurisdiction by January 2019.
And Compliance to begin by December 2019.
I plan to cover more aspects in future articles.