Chairman Massad has been vocal recently in his intent to clean up the quality of the data in the SDR. I recall him a few months ago speaking about the progress the CFTC has made policing the industry on data quality for vanilla interest rate swaps, so I thought I’d go have a look at FX options to see if Mr Joe Public (me) can glean anything from the public dissemination.
HIGH LEVEL VIEW
SDR Data
Let’s start with trade counts on SDRView. I picked some majors EUR/USD, USD/JPY, GBP/USD, USD/CHF, AUD/USD, and USD/CAD. I also kept USD/CNY in there as I was surprised to see such large numbers. In fact, I would have thought all USD/CNY should be reported as non-deliverable options (NDO’s) instead of Vanilla options. (Editors note: I have been informed that DTCC do not support CNH, so it is likely that all Vanilla USD/CNY is really USD/CNH).
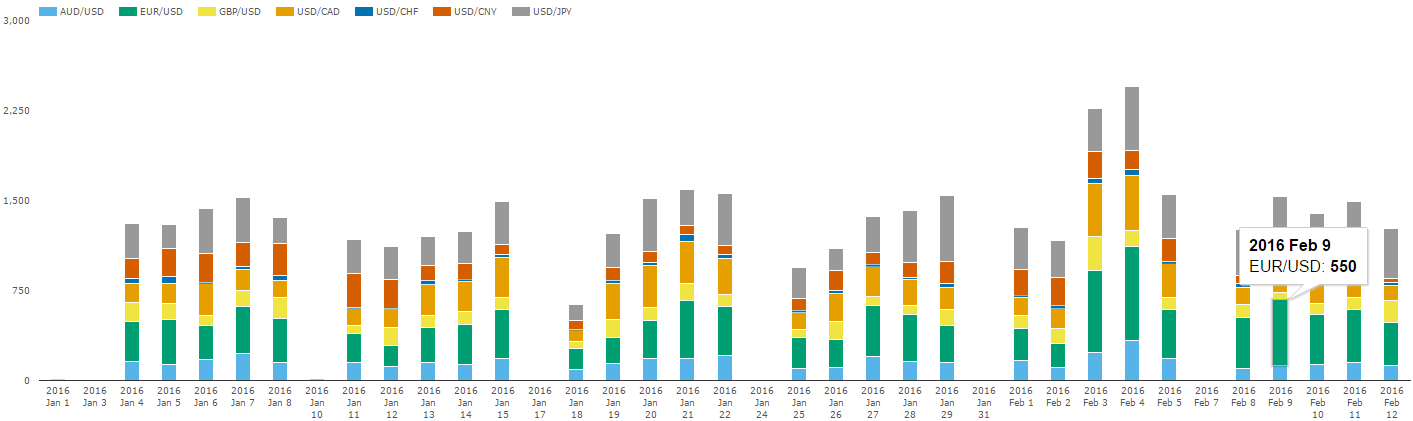
This shows some decent activity being reported:
- ~1,400 trades per day on average, peaking at 2,448 on February 4th
- 364 EUR/USD options per day on average, peaking at 782
- 350 USD/JPY options per day on average, peaking at 584
- 146 USD/CNY options per day on average, peaking at 286
- Not as much USD/CHF as I might expect, only averaging 28 trades/day
Switching this to gross notional, let’s see these same figures but this time just split by On/Off SEF:
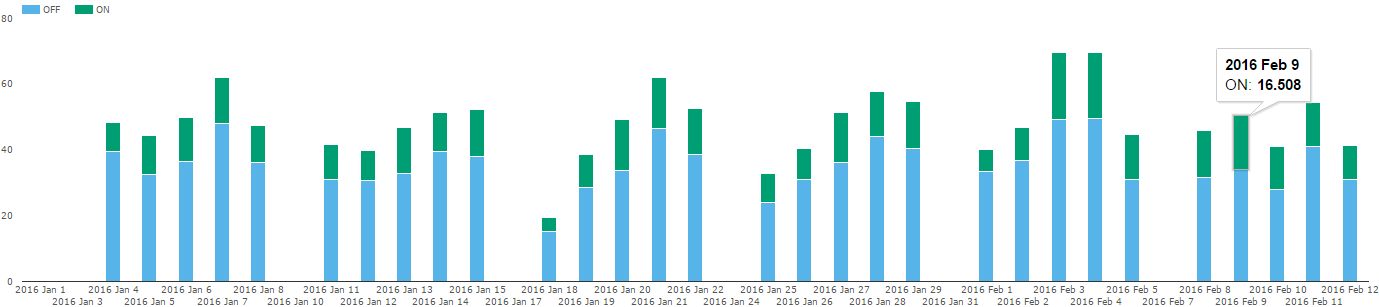
Which tells us that on average, 12.6bn USD of vanilla options get traded on SEF per day, while 35.6bn is traded off SEF. Hence only about 26% of options volume goes through SEFs, which is not bad considering the products are nowhere near being MAT’d. I should reference, however, that footnote 88 would have required all multi-dealer options platforms to have registered as a SEF, so we might begin to interpret all On-SEF activity as electronic, multi-dealer executed. But let’s leave that assessment to another day. Note also, that all volumes on SDR are subject to notional cap sizes, so we’d expect these figures to be understated by some degree.
SDRView vs BIS Report
At a macro level, I wanted to understand how much of the global options activity is going through SDRs. Just how much are we seeing?
It’s a bit tricky to use BIS data, given that it is every 3 years and aggregated at a high level. However the BIS report claims there was 337 billion USD of daily activity in FX Options in April 2013. If I look at daily FX Options activity for April 2013 on SDR, the daily activity was roughly 31bn USD. Which might lead you to think we’re seeing 10% of global activity.
Worth noting that if I look at ADV for YTD 2016, that number is now 62bn. But without a good global benchmark, it is hard to say. Whether the number is 10%, 20%, or something slightly lower or higher, I have some confidence that we are at least seeing a significant portion of the market. Particularly if you consider we’re probably not seeing many things like Asian crosses that would likely contribute to the BIS number but not contribute to the SDR.
SEF Data
The On-SEF market for options is largely in the interdealer brokers:
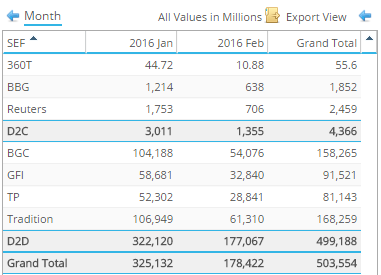
Some worthy tidbits:
- The majority of Dealer-To-Client options activity on SEF goes through Reuters (recent press release here)
- Tradition has the largest notional traded on-SEF. Remember that this is the ICAP/Tradition joint venture on FX Options, and through their Volbroker platform. As an aside, I do wonder what will become of this post ICAP/Tullet merger. I would guess the voice business goes to Tullet and Volbroker to ICAP – but what parts does Tradition keep?
- If you were to add the BGC and GFI activity, they would have the majority.
Last thing to mention here – if I cherry-pick one currency pair and compare it across SEFView and SDRView, I can get a rough idea of how much the SDR under-reports trades due to cap limits. Taking just EUR/USD, I was encouraged to find that year-to-date, the SDR reported 148bn USD, while SEFView reported 153bn. So it would seem we are only missing a few percentage points through caps on the SDR tape.
MAKING SENSE OF THE DATA
When compared to vanilla swaps, options are unique in that the market does not trade on “price” – but rather trades on a quoted volatility. Hence the transparency that one would wish to have is that of traded vol.
So, does the SDR tell you what vol was traded?
Of course not.
But fear not, if the other data is rich enough, we should be able to glean that information with some basic data cleansing, normalization and enrichment.
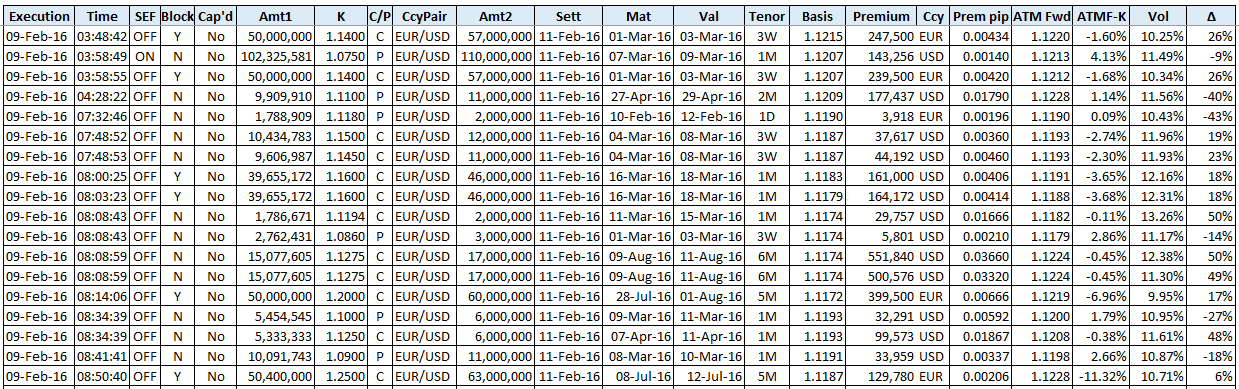
Case in point, I took all EUR/USD fx options activity on February 9, 2016, and began cleaning it up.
CLEANUP
In order to begin pricing options and doing some analysis, we need to do some basic cleaning:
- Enrich the data with spot settlement and value dates (from the given effective and maturity dates).
- Clean up the capped trades to give us a normal notional amount (eg “250,000,000+” to 250,000,000).
- Normalize the option tenors in order to do some nice aggregation.
- We need a spot reference for each trade. ICAP politely gave me EUR/USD tick data for Feb 9 to run the analysis, so I could enrich each trade with a spot basis.
- Normalized the premium amount into ccy2 pips terms.
- Computed the ATM Forward rate and resulting moneyness.
- Implied the option vol and computed the delta. Please note that I am not a quant by any means, but I simply wanted to see if I could get reasonable results.
- Determine if the option was a EUR call or a EUR put (yes, things are often not what they seem). More on this later.
- Removed some “garbage” trades. More on this later as well.
The result is a nice simple view of options activity that I would want to see (I am left with 507 trades):
This results in a fair representation of EUR/USD vol over the course of the day. Here is the 1-month traded vol:
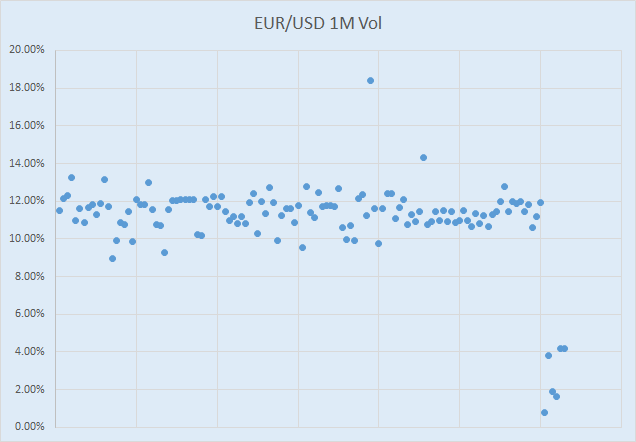
You’ll have to forgive some of the nonsense at the end of the trading day, as well as a couple of intraday blips. As a first pass, I am encouraged that it wasn’t complete nonsense. The next step would be to assess this as a vol/delta surface, so we could see ATM vol, the smile and any skew. Of course a few of those dots also deserve further attention, or to label the trade as “garbage” and keep out of my analysis. However I’ll defer all of this until later; as we need to walk before we run.
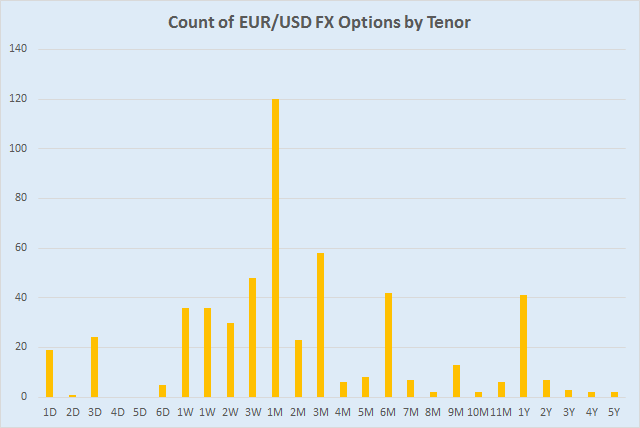
Finally, we can also get some good insight into which tenors trade the most. Clearly 1M options are king, and very little happens past 1 year.
THE DIRT
So in the spirit of constructive criticism, I thought I’d lay out the good, the not-so-good, and the ugly in options data on SDR.
To start with, I began with 550 or so EUR/USD options on February 9. There were some trades that I wasn’t comfortable I could clean up enough – so I labelled them “Garbage” and kept them out of my aggregate analysis. I’ll explain those in the “Ugly” section.
The Good
- I was impressed that the cap sizes translate nicely for FX Options. Of the 507 EUR/USD options on February 9th that I did not label as “garbage”, only 11 of them were capped.
The Not-So-Good
There are a number of things that I would not expect to be on the SDR, but that I would like to have in order to make transparency better:
- Spot Basis when the option was struck. The FX rate from any hedge crossed would be good.
- Dates for the premium settlement and value date would be useful, but enriching the trades with market practices should reveal 99% of the cases.
- Package / Strategy. I really expected to see many strategies. Of course no strategies are explicit on any SDR data, but we can often infer them through risk measures, time-stamps and other logic. Of the 507 EUR/USD options, 317 of them had unique time-stamps. And of the 200 like-timestamped trades, many of these included trades with the same economic terms (strike, direction & maturity), but just different notional amounts. Almost as if these were partial executions, and not strategies.
- Vol and/or delta that the option was struck at.
The Ugly
Many deficiencies made working with the data difficult, if not impossible:
- Normalized currency pair terms. It is often useful to treat the same currency pair as one product. For example, in EUR/USD, a USD call should be viewed as a EUR put vs USD. That is not to say that clients don’t request and trade USD calls or puts vs EUR, but a good representation will normalize these. This is admittedly nitpicky, because I would not insist that a firms’ database require this, as it is often important to know how the client transacted the trade (USD call), and one would want to be able to support inverted currency terms (eg 0.9000 USD/EUR). However, the lack of this standard has multiple implications on the quality of the SDR data:
- The option type (Call/Put) needs to have a reference. If you assume that the C/P refers to Currency 1 in the SDR (or even the normalized Ccy1), you end up with many cases where the premium does not even cover the intrinsic value of the option. Hence I needed to test the declared Call/Put by computing the implied vol both ways around before I concluded whether it was a call or put.
- There are cases where the amounts quoted do not equate to the strike. For example the 1.1500 strike on a 5,000,000 USD option, where the EUR amount is 5,750,000. Clearly the amounts are reversed/mis-quoted. One could argue that the strike might be inverted, but the pricing otherwise works on this trade if you assume a simple mis-quoted terms.
- Price / premium quote. Option prices are typically quoted in either ccy 1 percent or ccy 2 pips. Fortunately the premium amount quoted is often good, so we do not need to make sense of the price terms in the SDR, but there are some general premium issues (next point).
- Other Premium and Price problems that made me categorize the trade as “garbage”:
- Many standalone options (not packages) with 0 premium.
- Some options with premiums larger than the notional amount.
- Some options with an “Amount” premium but the amount was really a price or % (eg 0.005).
- Some options with a “Price” of 2+ million. Clearly those should be “Amount”
- Some options list the same value (eg 1.1400) as the price, the additional price, AND the strike.
- Some options list the same value (eg 0.04551) as the price as well as the total NOTIONAL premium amount
- PRICE NOTATION 2 and 3 are often used for a notional amount, price or strike. Regardless of whether it is good information (its superfluous in most cases), it does seem to be a signature for particular reporting counterparties.
- If we go outside of vanilla options, a slew of other issues:
- Barriers – A sheer lack of any information in many cases (very spotty premiums, spotty prices, strikes of 0.01, and of course no barrier information)
- Digital – Further lack of information. Often the reference currency pair is not given, likely justified because payout is a single currency, but is it a EUR payout on EUR/JPY or EUR/USD?! You might be able to guess if you had a trigger level – but get this – there is no trigger reported!
SUMMARY
I learned quite a bit by digging into the SDR data:
- 26% of FX Options are traded on SEF. Primarily this is dealer-to-dealer platforms. I would assume much of the balance of client activity is on single dealer platforms (off-SEF).
- Well over 1,000 trades per day are being reported in the 6 major currency pairs.
- Cap sizes of FX Options do not seem to limit transparency to any significant degree.
- The quality of FX Options SDR data ranges from decent for Vanilla options to bad for any kind of exotic.
- Vanilla options data has room for improvement, however we can glean decent insight into nearly 90% of trades in at least EUR/USD.
Transparency is a great thing, but it would seem some policing on the quality of the data remains to be done.
If you have more interest to explore FX Options data on the SDR, please leave a comment or contact us.