In this article I will look at FX Options trade volumes as reported to US Swap Data Repositories and volumes published by US Swap Execution Facilities. This analysis highlights the following:
- Vanilla FX Option volume averages 24,000 trades a month in the largest 10 currency pairs
- EUR/USD is the most active pair with up to 11,500 trades or $600 billion notional a month
- 2015 Volumes are 30% higher than 2014
- On SEF is 27%, while Off SEF is 63% of volume reported by US persons
- Barrier Options have comparable trade volume to Vanilla Options but a fraction of the notional
- Tradition is the leading SEF with 34% share (in the 10 pairs)
- BGC is close behind with 29% share
- D2C SEFs have <1% of the volume
Now onto the charts, data and detail.
Volumes in 2015
Using SDRView we can look at 2015 monthly trade count volumes of Vanilla Options for the ten most traded currency pairs.
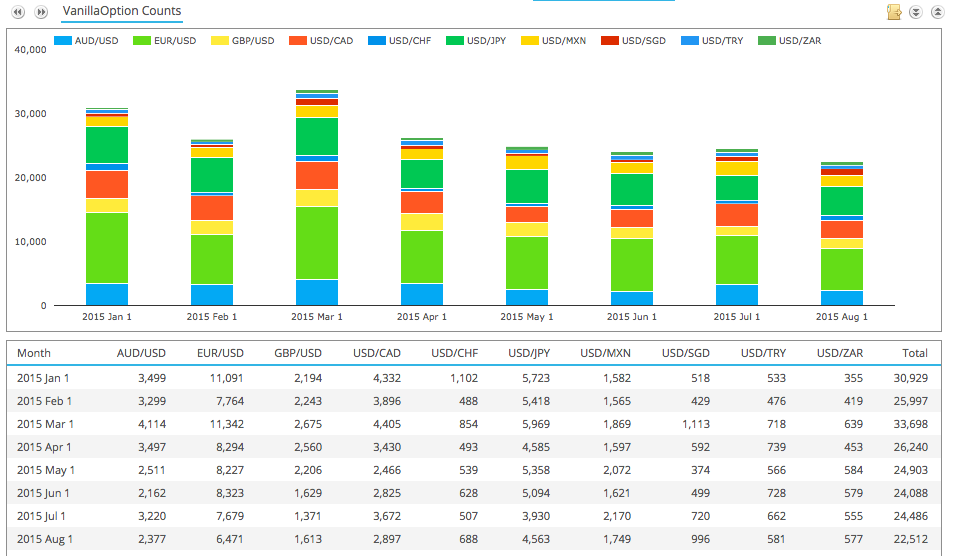
Showing that:
- March 2015 was the highest volume month with 33,698 trades reported
- Monthly trade volume for the recent 5 months is consistently around 24,000 trades a month
- Only Calls and Puts are reported, which means Straddles are being reported as two trades
- EUR/USD is the most traded pair with 6,500 to 11,500 trades each month
- USD/JPY is the next most traded with 4,000 to 6,000 trades
- USD/CAD and AUD/USD follow with 2,000 to 4,500 trades
- GBP/USD and USD/MXN next with 1,500 to 3,000 trades
And the same in gross notional terms.
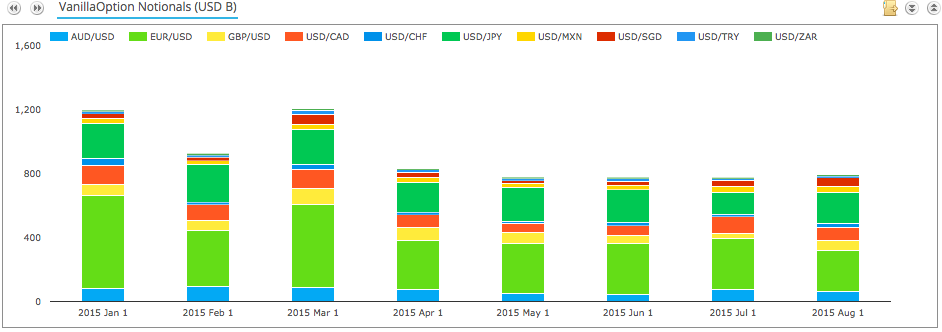
Showing that:
- March 2015 was the highest with > $1,200 billion traded
- Recent months have consistently averaged > $775 billion
- Recall that capped notional rules mean that actual volumes are somewhat higher
- Gross Notional of Capped trades averages between 15% to 24% of the Standard trades
- Suggesting that Actual Gross Notional may be 10% to 20% higher than the reported figures
- EUR/USD is the most traded pair with $260b to $580b gross notional per month
- USD/JPY is the next most traded with $135b to $240b gross notional
Comparing to 2014 Volumes
Lets see how this compares to the corresponding period in 2014.
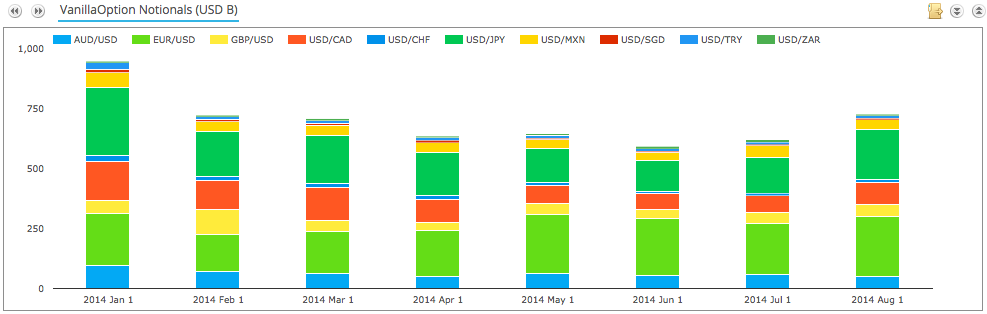
Every month in 2015 is higher than the corresponding month in 2014, some much more so e.g. March.
Gross notional volume is on average 30% higher in 2015 vs 2014.
A sign of more currency volatility leading to more hedging and speculation?
On SEF vs Off SEF
What about On SEF vs Off SEF trading.
Again for the same 10 currency pairs.
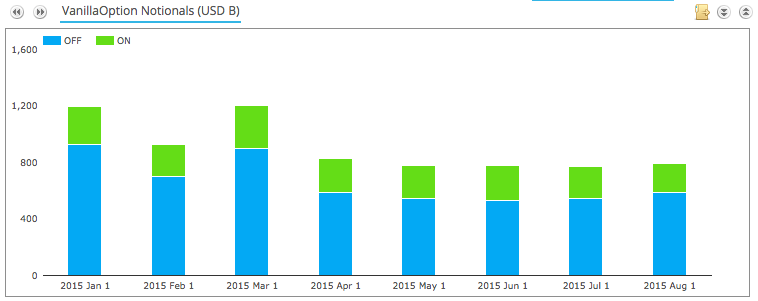
Showing that the majority of trading is Off SEF.
Not surprising as their is no mandate to trade FX Options On SEF and their is no Clearing.
In-fact On SEF is on average 27% of total gross notional, while Off SEF is 73%.
The corresponding period in 2014 had 32% On SEF and 68% Off SEF.
So 2015 shows a drop of 5% in On SEF.
Statistical noise or a trend caused by different behaviour e.g more Client trading in 2015?
Barrier Options
As well as Vanilla Options, a decent amount of trading takes place in Barriers.
The table below shows trade counts in August 2015 for currency pair and product type.
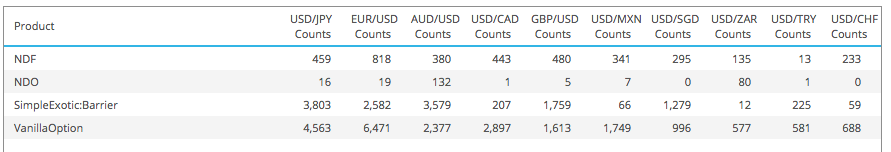
Showing that:
- In some pairs, AUD, GBP and SGD more Barrier trades were traded than Vanilla
- Only in CAD, MXN and ZAR are the Barrier trade counts far lower than Vanilla
- (NDO is Non Deliverable Option and NDF is Non Deliverable Forward)
- (Not sure why these are being reported in USD/JPY or EUR/USD which are deliverable currencys!)
However in Gross Notional terms Barriers are far smaller than Vanilla, as the table below shows.
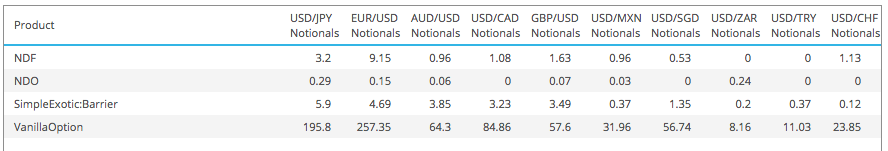
Meaning that the notional size of each barrier option is a small fraction of the size of a vanilla option.
SEF Market Share
Using SEFView we can look at market share for each SEF for our 10 currency pairs.
First for the period 1 Jan to 31 Aug 2015.

Showing that:
- EUR is by far the biggest
- BGC and Trads are the leaders
- GFI and Tullets follow
- Reuters shows some volume
- CAD and JPY are the next largest pairs
The same data but as percentage share.
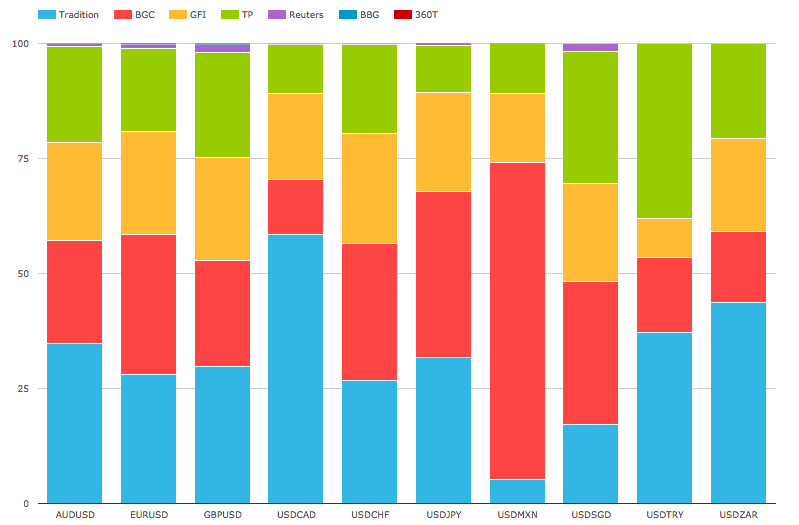
Showing that:
- BGC dominates in MXN
- Tradition dominates in CAD
- Tradition is top in AUD, GBP, ZAR
- BGC is top in EUR, CHF, JPY, SGD
- GFI is strong in all pairs
- TP is top in TRY and strong in all pairs
- D2D SEFs dominate the figures
- D2C SEFs have less than 1% share
And a by month view to look for any change in share over the year.
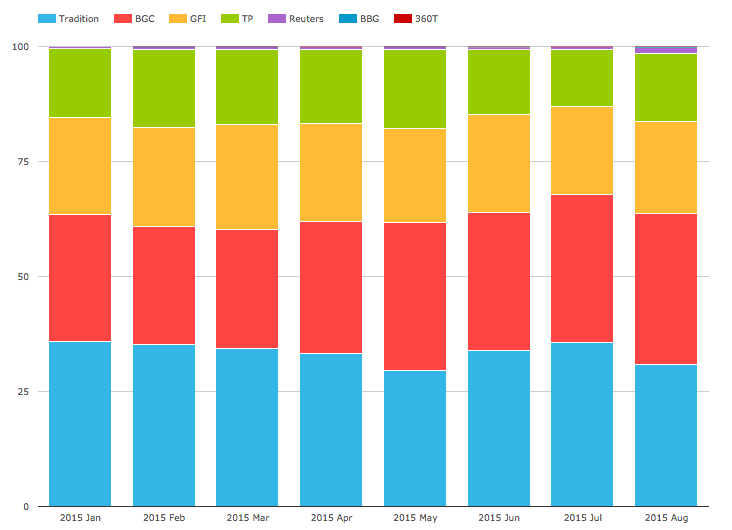
Showing that:
- Tradition has 34% share, with a low of 30% in May and Aug
- BCG has 29% share, with a low of 26% in Feb and a high of 33% in Aug
- GFI has 21% share, with a low of 19% in Jul and a high of 23% in Mar
- Tullets has 15% share, with a low of 12% in Jul and a high of 17% in May
- Reuters has 0.6%
- BBG and 360T < 0.1%
Thats it for market share.
Final Thoughts
There is lots of interesting data available on FX Options.
Today’s blog has just scratched the service.
I hope to look in future at more detail.
Including Expiry’s, Strikes, Prices, Straddles, Frequency of trades, …
there is a typo, ndf is non deliverable forward
super thanks for point out, have corrected