Following our introductory blog, 2024 US SDR-Reported IR Compression, published in May 2025, we review today the same compression volumes for the first half of (H1) 2025.
Key takeaways
- Overall, the H1 2025 surge in SDR-reported product compression volumes to $97.4 trillion aligns with the surge in cleared OIS and fixed float IRS covered in our recent blog, Q2 2025 CCP volumes and share in IRD.
- OIS compression was $69.2 trillion – up 66 percent YoY. D2C platforms handled the majority, with bilateral taking most of the remainder.
- Fixed float IRS compression was $8.3 trillion – up 49 percent YoY, with a similar platform-type split to OIS.
- FRA compression was $18.8 trillion – up 5.9 percent YoY, and still dominated by EUR reset compression.
- Basis swap compression was $663 billion – up about three-fold YoY, dominated by bilateral activity.
- Swaptions compression was $501 billion – up about ten-fold YoY.
Background
Note that SDRView is roughly half the total swaption compression volume, because trades are only reported to SDRs if they involve a US party. Nonetheless, SDRView remains a good guide to the volume dynamics over time.
To avoid confusion, I reiterate from the above-linked blog that SDR-reported compression does not include the following types of compression:
- CCPs’ own compression services – netting and blended compression by a CCP’s compression service. CCPs may report volumes on their websites.
- Multilateral vendor compression – compression by third-party vendors of uncleared or cleared trades using the vendor aspect of a CCPs’ compression infrastructure. The vendor reports volumes using a third-party portfolio compression approved publication arrangement (APA).
Otherwise, I will limit duplication of the prior blog. You might want to glance through it now, or keep it open for reference while reading on.
Overall volumes
All SDR-reported IR compression in H1 2025 can be summarized as follows.
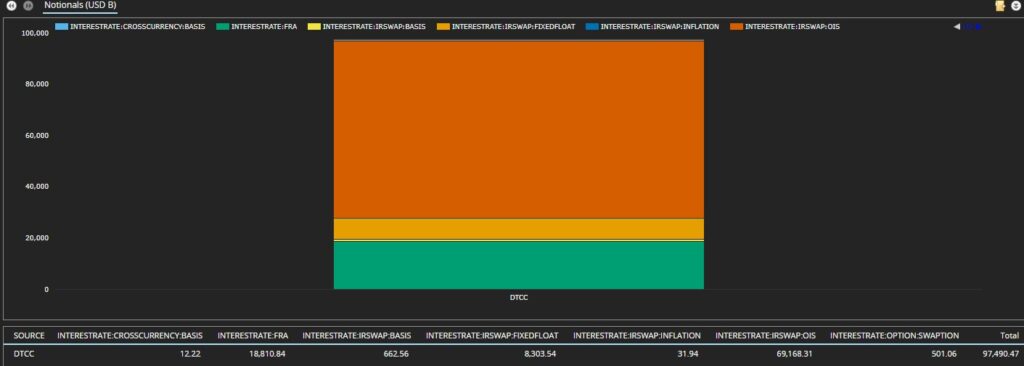
Chart 1: H1 2025 US-reported IR compression notional volumes by product, cleared vs. uncleared, and platform type (USD billions). Source: SDRView
Chart 1 shows that US-reported IR compression across all currencies, product types, platforms, and across cleared and uncleared were $97.4 trillion – up 50 percent YoY from $65.2 trillion. I charted all products to help you visualize the relative size – even at the risk of invisibility for some products!
- OIS was the lion’s share with $69.2 trillion – up 66 percent YoY from $41.6 trillion.
- FRA was next with $18.8 trillion – up 5.9 percent YoY from $17.8 trillion.
- Fixed float IRS was next with $8.30 trillion – up 49 percent YoY from $5.57 trillion.
- Basis swaps were $663 billion – up 326 percent YoY from $156 billion.
- Swaptions were next with $501 billion – up 975 percent YoY from $46.6 billion.
- Inflation swaps were $31.9 billion – down 8.1 percent YoY from $34.7 billion.
- Cross-currency swaps were $12.2 billion – up 83 percent YoY from $6.67 billion.
I will skip FRA and swaptions from further analysis, since the main driver of each is different from the usual desire for line-item and notional reduction. Watch this space for a separate blog on compression of each product.
I will also skip inflation and cross-currency swaps, given the immateriality of their compression volume.
This leaves me to drill down on OIS, fixed float IRS, and basis swaps.
OIS compression
We look at month-by-month volumes by platform.
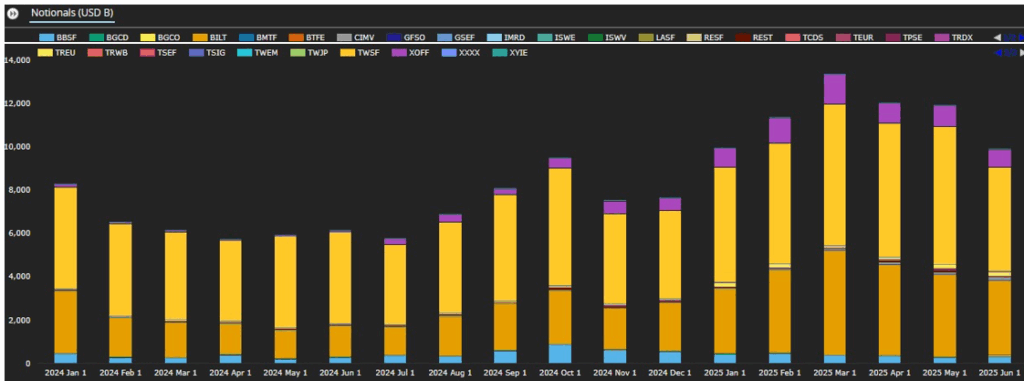
Chart 2: US-reported OIS compression notional volumes by platform (USD billions). Source: SDRView
Chart 2 shows the month-by-month platform breakdown of the $69.2 trillion H1 2025 volume – up YoY by $27.6 trillion (66 percent) from H1 2024. March 2025 had the highest volumes with $13.4 trillion – a new record. Each month in H1 2025 exceeded the prior record in October 2024 of $9.5 trillion!
- Tradeweb (all platforms) was the main D2C player with $35.8 trillion – up YoY by $10.4 trillion (41 percent). Apart from TWSF, their main US platform, TREU (one of the European Tradeweb platforms), was $969 billion – up YoY by $792 billion (447 percent).
- Bloomberg (all platforms, but mainly BBSF – in pale blue) was the only other D2C player with $2.25 trillion – up YoY by $409 billion (22 percent).
- Off platform (all ids) was $29.8 trillion – up YoY by $16.0 trillion (117 percent). Bilateral (BILT in dark orange) and off-platform trades in electronically tradeable instruments (XOFF in purple) were the main factors.
- D2D (all platforms) was $1.31 trillion – up YoY by $696 billion (113 percent). They are the colored slivers sandwiched between light orange and dark orange bars in the chart.
If now we chart the currency breakdown, we get the following.
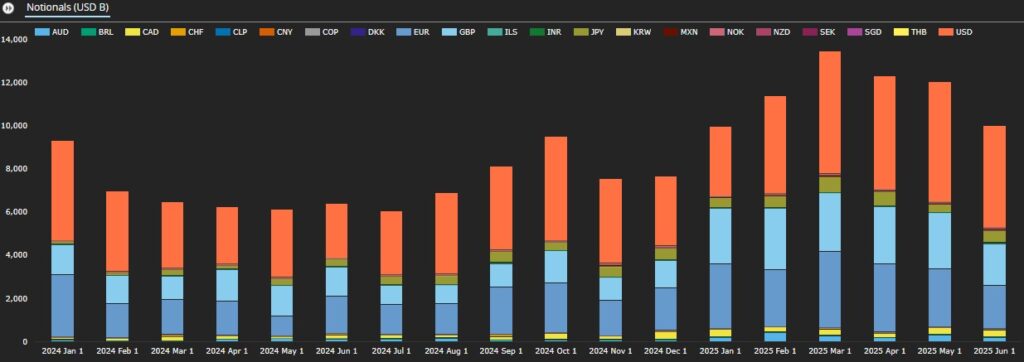
Chart 3: US-reported OIS compression notional volumes by currency (USD billions). Source: SDRView
Chart 3 illustrates the H1 2025 currency breakdown of OIS compression volumes. The figures can be used to generate the following analysis:
- USD, EUR, and GBP combined were 88.5 percent of H1 2025 OIS compression volumes – down YoY from 91.6 percent.
- JPY, CAD, and AUD combined for 9.4 percent – up YoY from 6.3 percent.
- Non-G6 currencies were 2.1 percent – up slightly YoY from 2.0 percent. Many non-G6 currencies were active – 9 had activity every month of H1 2025 (MXN, NZD, CHF, INR, BRL, SGD, COP, THB, CLP), while another 5 had activity sometime in the period (ILS, SEK, KRW, DKK, NOK).
Fixed float IRS compression
Note that we have removed LIBOR transitioned currencies (USD, GBP, JPY, CAD, CHF, SGD, THB) from the fixed float IRS analysis. This is, in fact, a low-volume misreporting of OIS trades for the big currencies, which muddy the picture for the smaller in volume real IRS currencies.
First, we look at month-by-month volumes by platform.
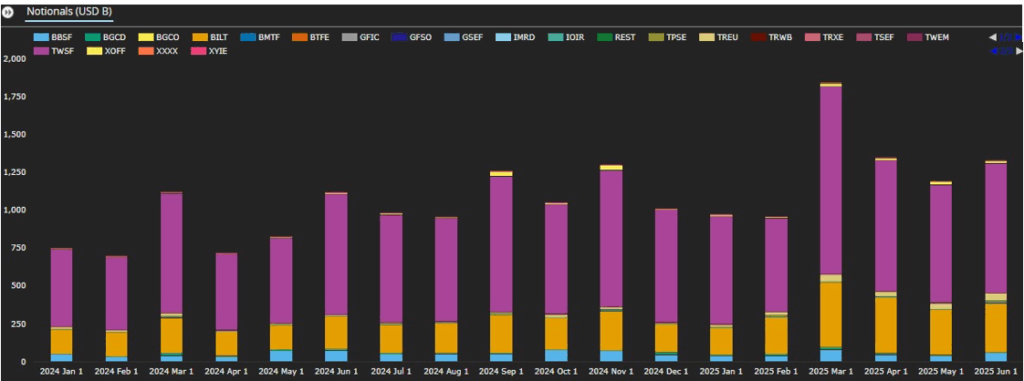
Chart 4: US-reported fixed float IRS compression notional volumes by platform (USD billions). Source: SDRView
Chart 4 shows the month-by-month breakdown of the $7.6 trillion H1 2025 volume – up YoY by $2.41 trillion (46 percent) in H1 2024. March 2025 had record high volumes with $1.84 trillion. Each of March, April, and June exceeded the prior record in November 2024 of $1.30 trillion.
- Tradeweb was $5.29 trillion – up YoY by $1.53 trillion (40 percent). TWSF,this time in purple, was the main factor, but again TREU, in muted yellow, grew disproportionately.
- Bloomberg (mainly BBSF – in pale blue) was the only other D2C player with $311 billion – down YoY by $3.65 billion (1.2 percent).
- Off platform (all ids) was $1.94 trillion – up YoY by $818 billion (73 percent). Bilateral (BILT – in dark orange) and off-platform trades in electronically tradeable instruments (XOFF in – this time in bright yellow) were the main factors.
- D2D (all platforms) was $94.5 billion – up YoY by $28.7 billion (44 percent). They are the slivers sandwiched between the purple and orange bars in the chart.
Now, we look at fixed float IRS by currency.
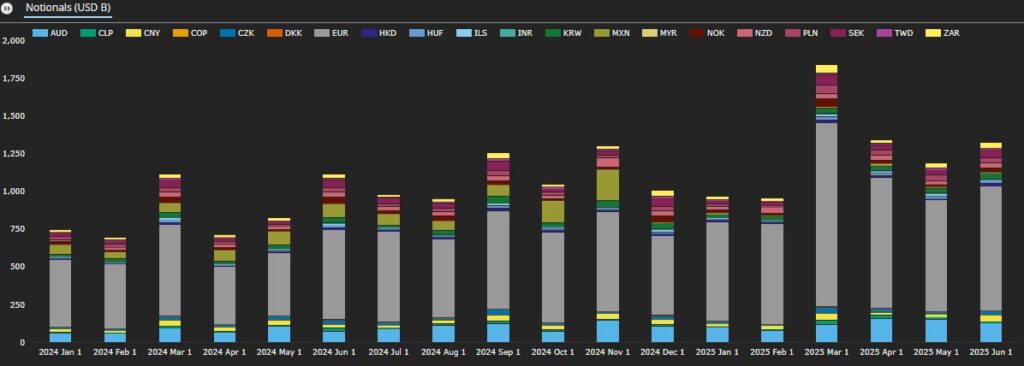
Chart 5: US-reported fixed float IRS compression notional volumes by currency (USD billions). Source: SDRView
Chart 5 illustrates the currency breakdown of month-by-month fixed float IRS compression volumes. Since the LIBOR transition all but removed this product from USD, GBP, JPY, CAD, CHF, SGD, THB, the generated analysis by currency looks different:
- EUR and AUD were the largest two currencies with a combined 75.1 percent of H1 2025 volumes – up YoY from 64.4 percent.
- Non-G6 currencies were 24.9 percent – down YoY from 35.6 percent.
- 15 non-G6 and non-LIBOR-transitioned currencies had compression volume every month in H1 2025 (SEK, ZAR, PLN, KRW, NZD, CNY, NOK, CZK, HUF, CLP, HKD, TWD, ILS, MXN, INR) while another three currencies had compression volume in three or more months of H1 2025 (MYR, DKK, COP).
Basis swap compression
By platform and currency, the volumes look like this.
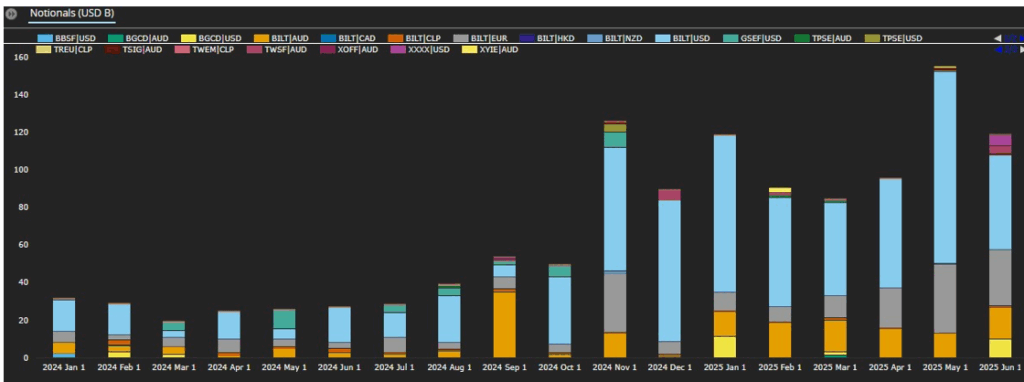
Chart 6: US-reported basis swap compression notional volumes by platform and currency (USD billions). Source: SDRView
Chart 6 shows the month-by-month breakdown of the $663 billion basis swap compression volumes in H1 2025 – up YoY by 326 percent from $156 trillion in H1 2024.
- Bilateral dominates with 93% of the volume, while platforms had volume in occasional months.
- Despite the LIBOR transition, USD is the largest currency with $431 billion – reflecting Fed Funds vs SOFR activity.
- Non-LIBOR-transitioned currencies completed the picture: EUR with $118 billion, AUD with $109 billion and CLP with $4.80 billion.
End note
- That is all for now. To recap the key takeaways, see the section near the top.
- Watch this space for regular coverage of this topic going forward, and for separate blogs on FRA and swaption compression.
Contact us if you are interested in using SDRView.