Continuing with our monthly review series, let’s take a look at Interest Rate Swap volumes in January 2015.
First the highlights:
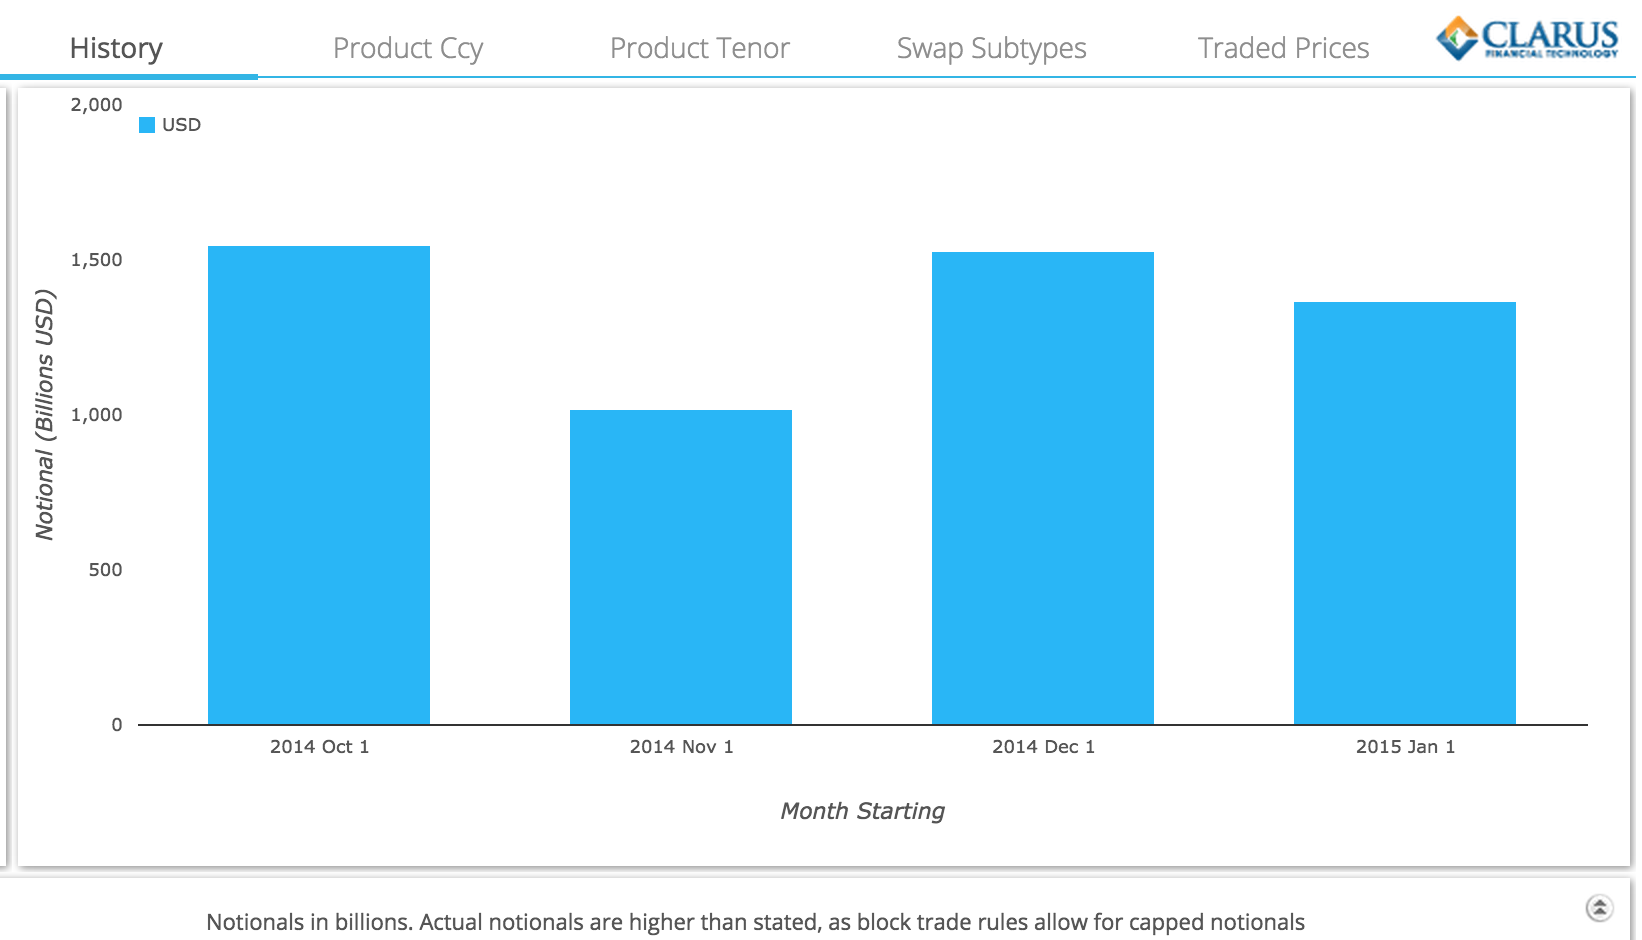
- Decent volumes but lower than December.
- Surprising given the large price moves, with 30Y down 50bps and 9 out of 22 days with >5bps moves in the 5Y.
- Global USD IRS volumes show LCH SwapClear with 67% share and CME with 33%.
- LCH SwapClear reducing Dealer Notional Outstanding by $6 trillion in the month via compression.
- BBG and TW losing some market share as compared to Dec.
- With Tradition and TrueEx the big gainers.
And now for the data and details.
USD IRS ON SEF
First a SDRView chart for the prior 4 months shows that January was lower than both December and October.
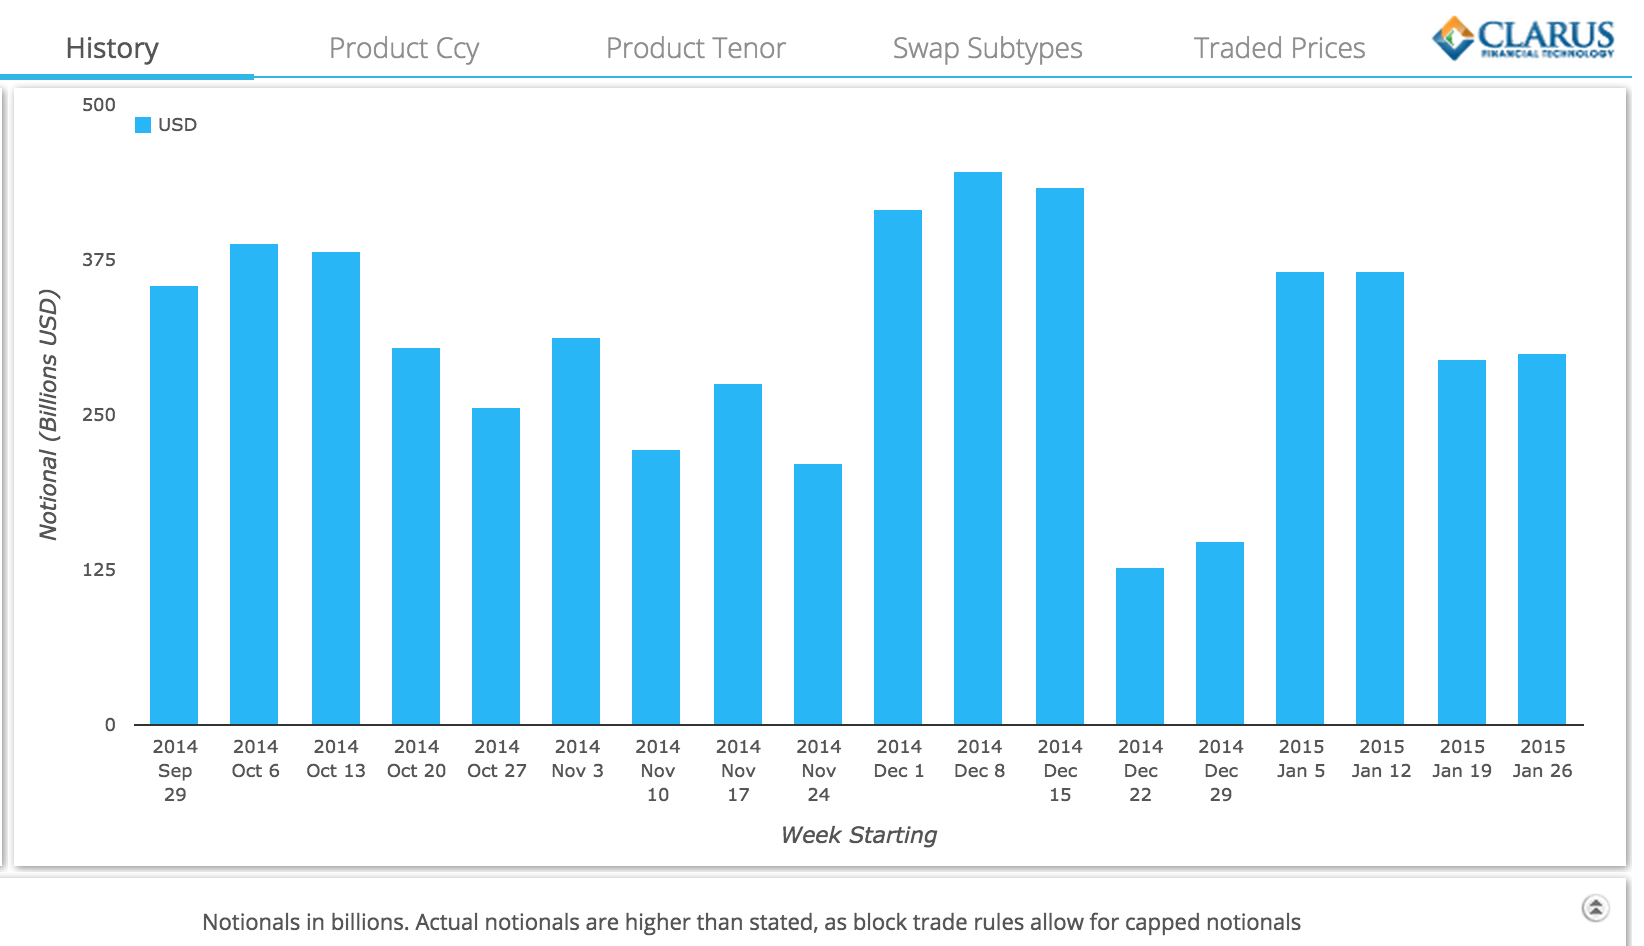
And the same period by by week shows fairly even weekly volumes in January as opposed to the peaks seen in December
Market Moves
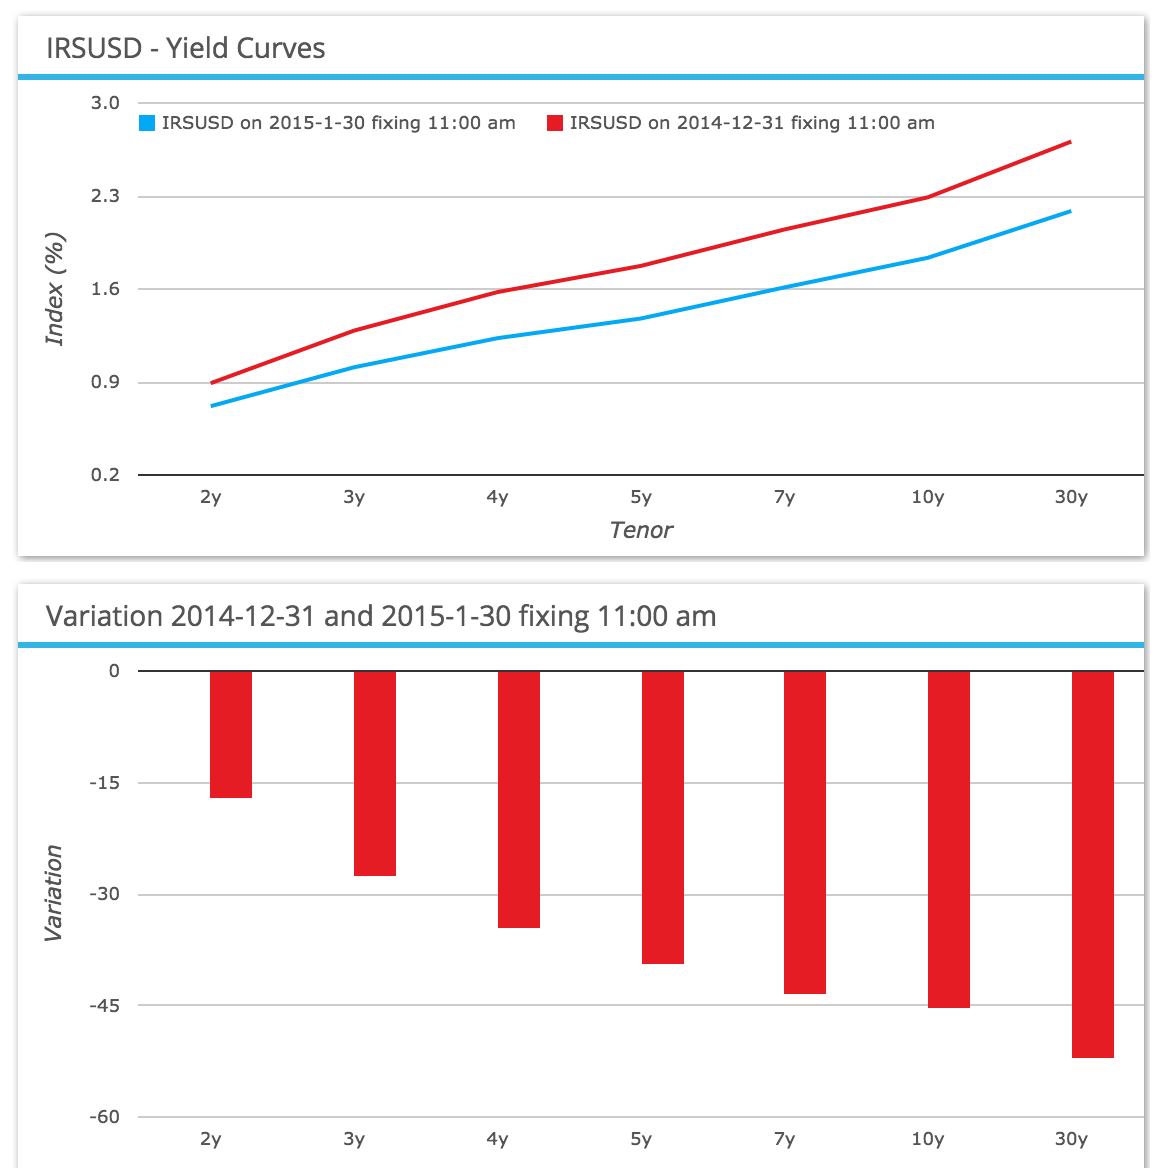
Using SDRFix we can see that the Swap market in-fact had a big month in terms of price moves.
A very significant flattening of the swap curve with short rates down 15 basis points and long rates down 50 basis points.
Looking at the daily price moves in 5Y we see that there in 9 days out of 22 we had moves of greater than 5 bps, mostly down.
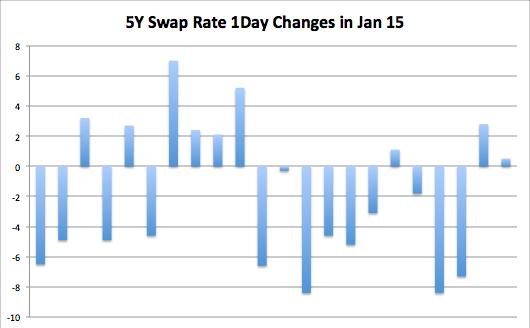
These price moves are greater than those in December, so it is a little surprising that January volumes were lower.
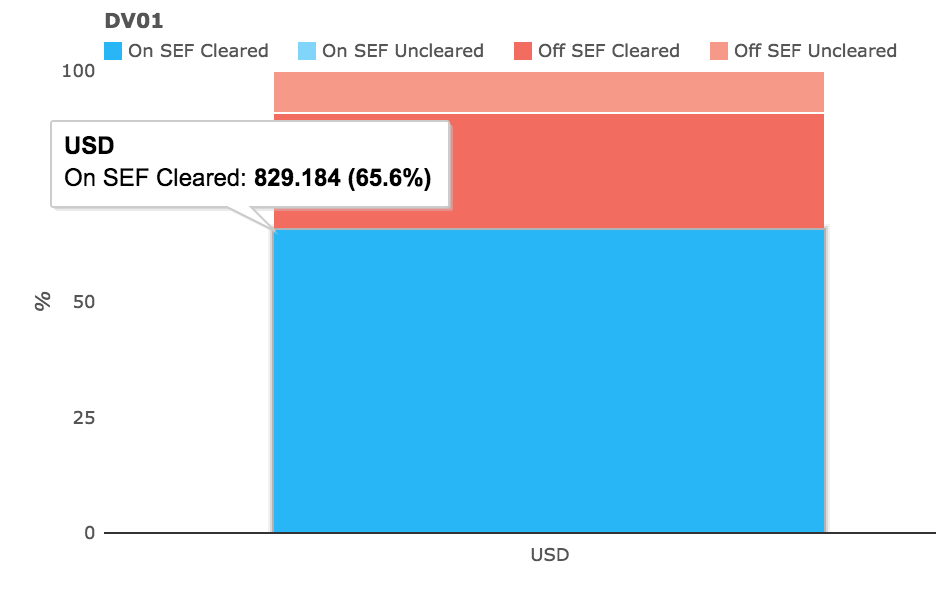
OFF SEF
A chart shows that On SEF represented 65% of DV01 volume and Off SEF 35%, split between Cleared and UnCleared in a 2.5 to 1 ratio.
Global Cleared USD IRS Volumes
Using CCPView we can look at global volumes, which for USD shows LCH SwapClear has 67% of the January volume and CME 33%.
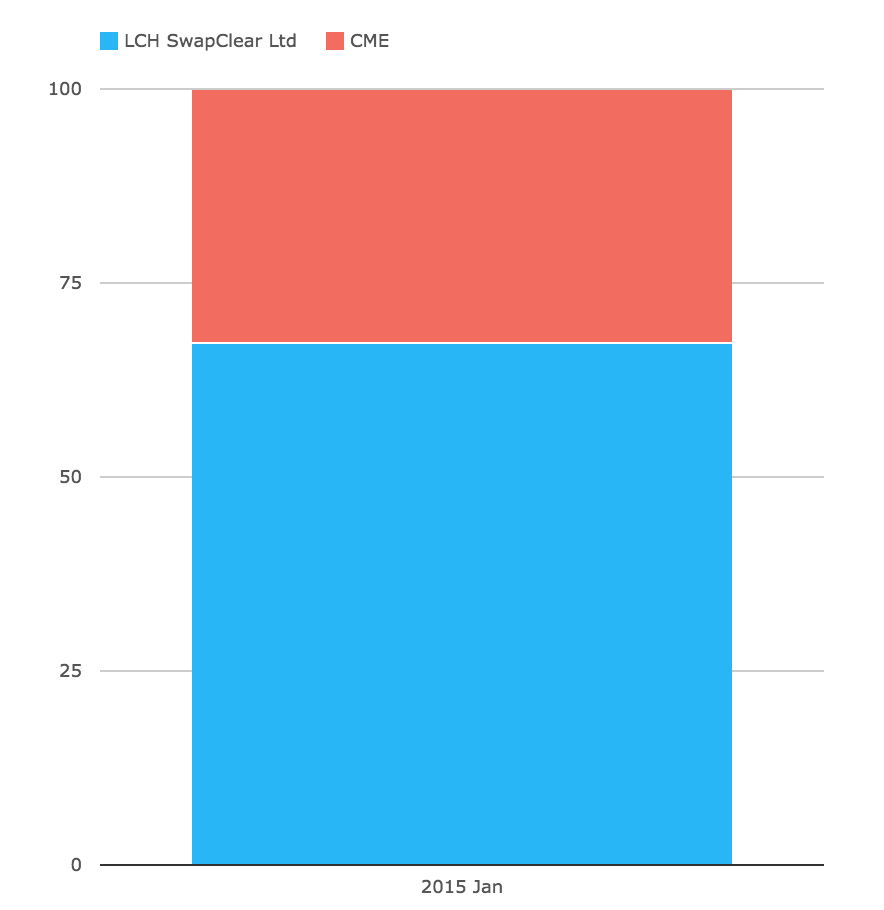
(As a note these volumes are global and not just for US persons as neither CCP breaks out US Persons vs European and Asian).
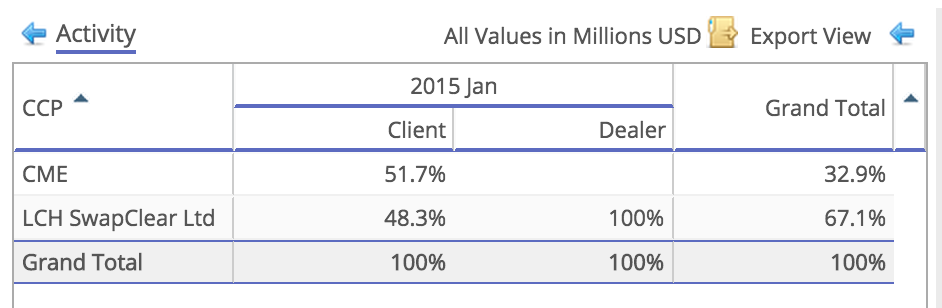
And the same shown in a table with Client and Dealer breakdown shows that if we assume CME volumes are all Client and compare to the LCH SwapClear Client volumes we see a 52% to 48% split. However as CME does not disclose its Client to Dealer split and we know there is some Dealer activity at CME, I leave it to you to decide whether 33% and 67% is a more accurate representation.
The same table but this time in USD millions:
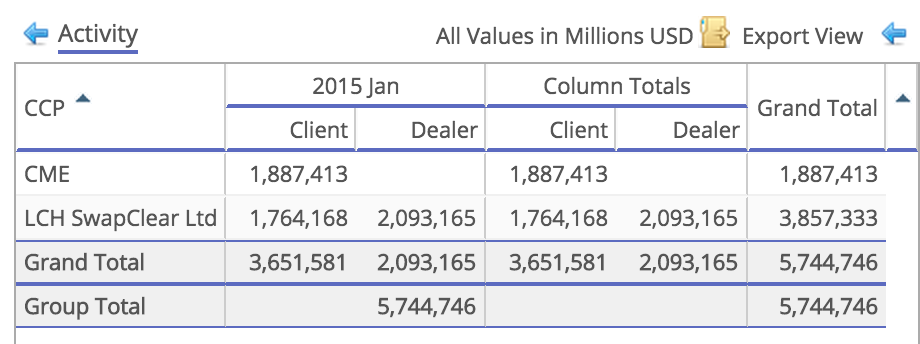
An interesting point to note is the amount of Compression that took place on LCH SwapClear in January.
The table below shows Open Interest for Dealer volume dropping from $42 trillion to $36 trillion, even with new trade volume of $2 trillion.
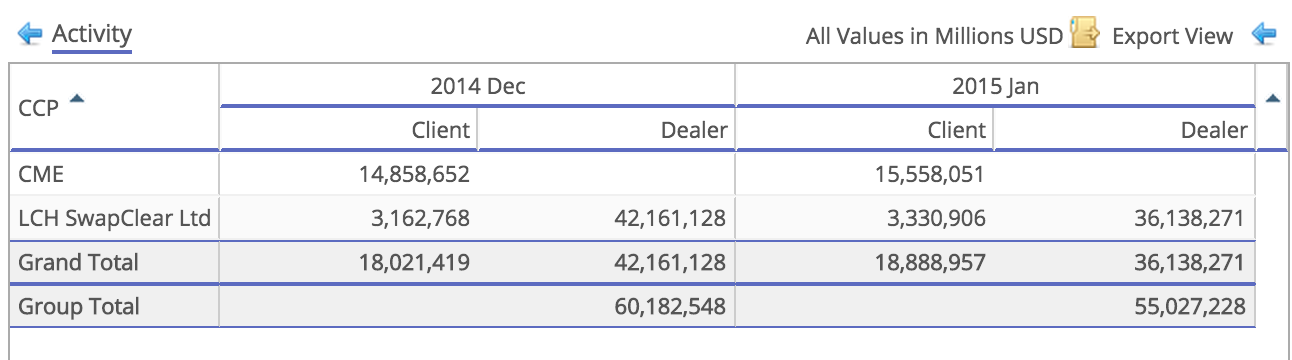
Now we do not know the volume of swaps maturing in January, so ignoring that we can say that Compression (whether TriReduce or LCH’s own) reduced Outstanding Volume in USD IRS by approximately $8 trillion.
A very big number and one we know that large Dealers are driven by regulatory cost to reduce.
SEF Volumes and Share
And finally onto SEFView figures.
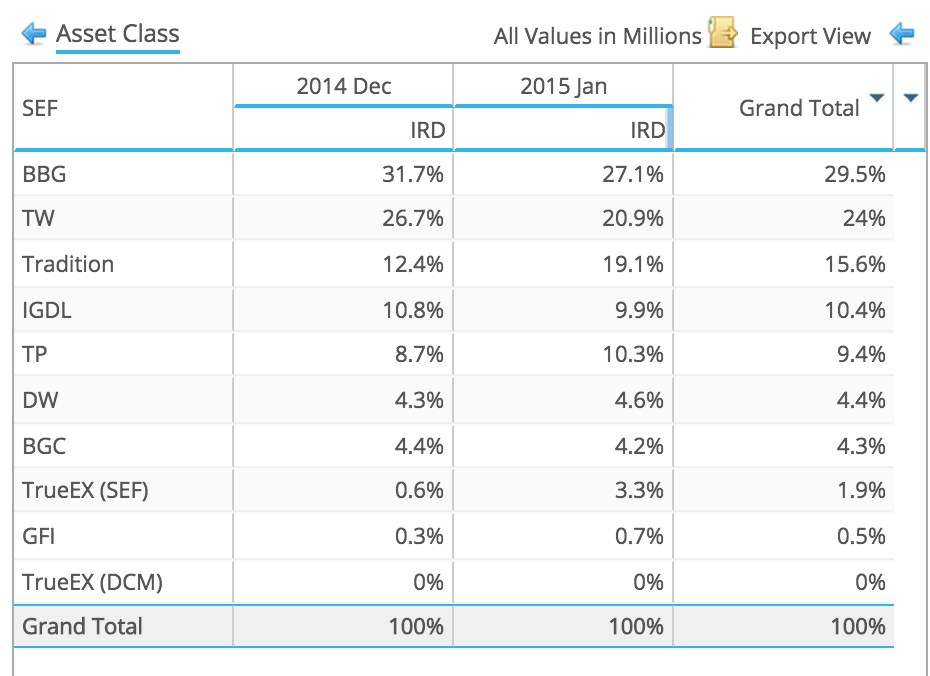
First comparing Dec and Jan percentages for USD IRS (both fixed v float and basis) we see a 4.5% lower share for BBG and 5.8% lower for TW, with the gains going to Tradition (6.7%) and TrueEx (2.7%).
The same table but in USD 5Y Swap equivalent in millions:
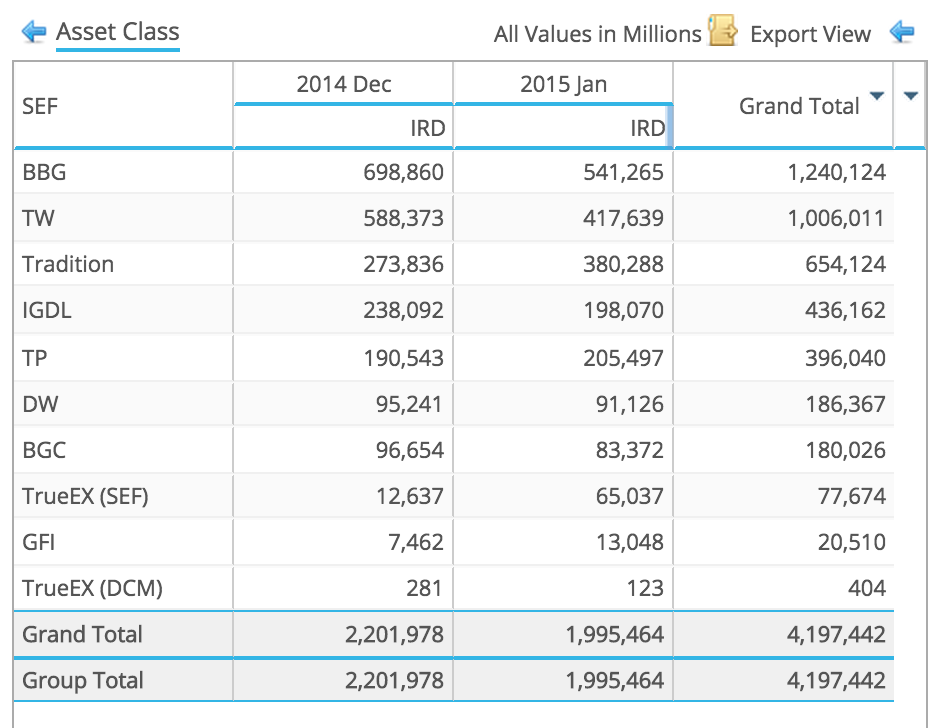
We might make the assumption that there were proportionally larger dealer flows vs client flows in Jan over Dec. Smallish gains for TP and DW would seem to corroborate that alongside Tradition but then IGDL does not show the same gain.
So worth delving deeper specifically into Tradition and TrueEX figures.
TrueEx we can see posted some very large daily figures for its package termination, just on 20 Jan we see over $34 billion in total with almost $16 billion in 2Y.
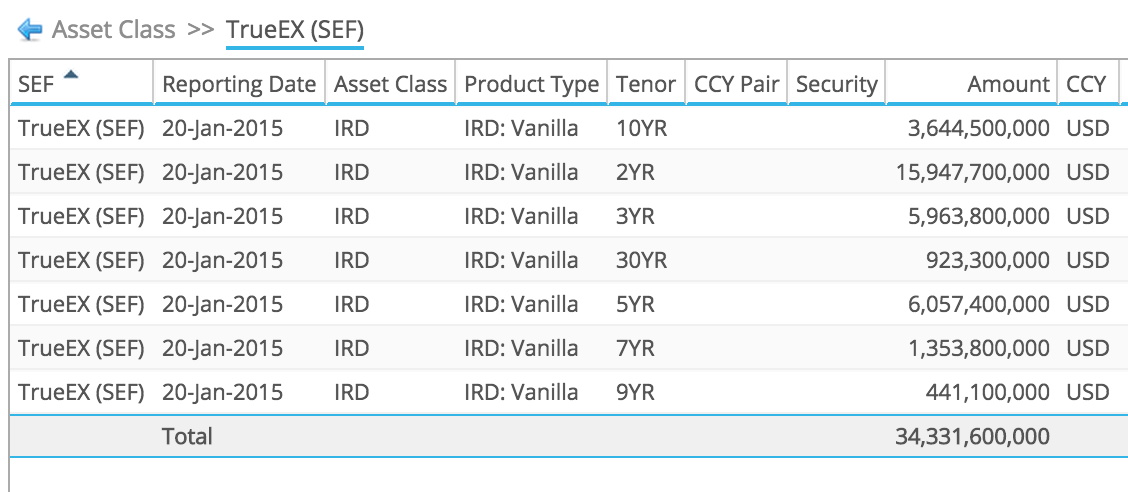
And the monthly volume of $65 billion in 5Y equivalents marks a very successful month for TrueEx. I don’t recall seeing them post such large package terminations number before. (I could check but rapidly running out of runway to the deadline).
So moving on to Tradition.
We see that daily volume in 5Y Swap equivalent exceeded $20b on six days in Jan on 8, 12, 13, 14, 21 & 22.
Selecting one of these, lets say 22 Jan and drilling down we see that the largest volume is in 5Y at LCH and then 5Y at CME.
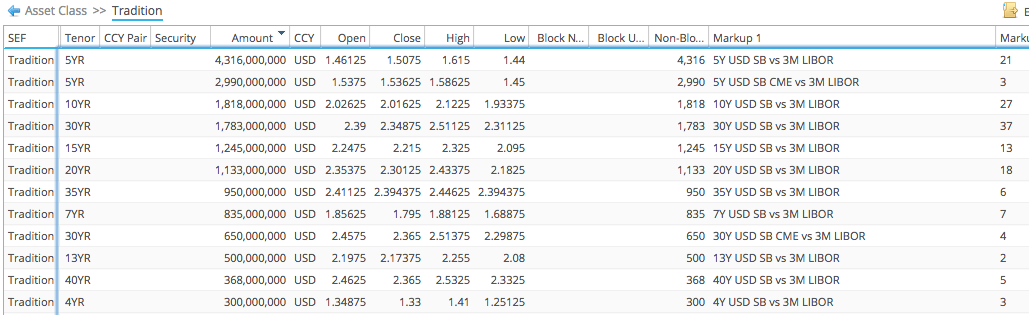
Given that the CME $3billion number is from 3 trades and the LCH $4.3 billion from 21 trades, we might think this is evidence of trading activity in LCH-CME Basis Swaps; it certainly looks like it from the data.
Alternatively Dealers may just have traded more on Tradition in January, perhaps specifically in Butterflys and we see some evidence of that e.g. 13 Jan with $1.5 billion in 13/14/15 Flys.
Thats it for SEF figures.
Summary
January USD IRS volumes were decent but down on December.
Surprising given the market moves in the month with long rates down 50 bps.
Global Cleared Volumes show LCH has 67% vs CME 33% in USD IRS.
LCH compressed approx. $8 trillion in the month to reduce Dealer USD Notional Outstanding to $36 trillion.
SEF Market Share for USD IRS shows TW and BBG down from Dec to Jan.
While Tradition and TrueEx gained.
TrueEx from package termination runs.
Tradition from a number of factors (LCH-CME Basis Swaps, Flys, …)
An interesting month.
Lets see what change February brings.