There has been much recent press on the investigations into ISDAFIX and whether this will turn-out to be similar to the LIBOR rigging scandal.
See CFTC’s Path in Rate-Swaps Probe or US Regulators ‘find evidence’ of banks fixing derivative rates.
While there is much speculation that millions of emails will have to be sifted through to find evidence of manipulation, as I am not a lawyer being paid an hourly rate and nor do I have access to these private emails, I decided to see whether there were other ways of determining price manipulation.
Lets start with a definition: ISDAFIX is determined from a poll of price contributions from dealers, the process is explained on the ISDA site.
For USD the process is different, in that “ICAP provides a reference point from information contained on its Reuters 19901 page at 11:00 am, which reflects the most recent swap spreads from completed trades and executable bids and offers in market size done/posted at ICAP”.
One possible way to influence or manipulate the rate would be to enter into trades close to 11:00am EST that were away from the market. Presumably these would be in average or smaller than average size as the risk is that these might be lifted at a loss.
So I decided to look into the data we have in SDR View (sourced from the DTCC DDR dashboard), firstly to understand at what times trades are done on a given day and secondly to check more closely around 11:00am EST.
By exporting all USD IRS trades on a recent business day, and creating a graph based of trade counts versus execution time in the public-dissemination feed from DTCC, I can see the following:
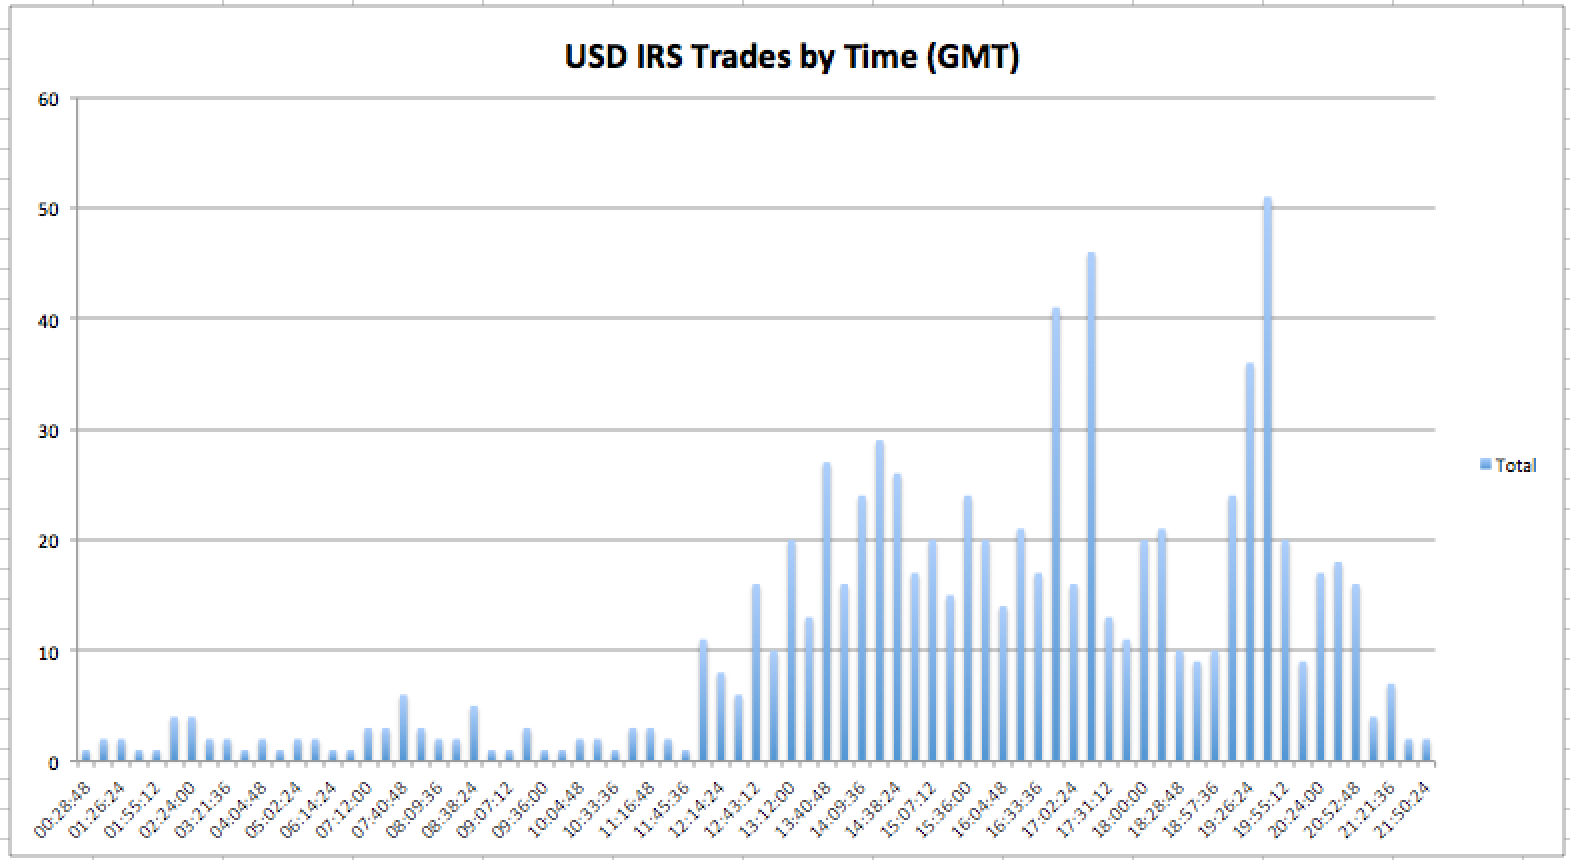
We can then observe the following from this:
- There is very little trading until 12:00 GMT, 1:00 pm LON, 8:00 am EST, as we would expect.
- Activity than increases up to 10:40am EST and then dips before picking up at 1:00pm EST or 6pm Lon close.
- There is then a dip in activity until increasing again to a high point around 5:40pm EST (NY Close)
- And then from 7pm EST activity falls off
- So nothing stands out in number of trades done around 11:00 EST (15:00 GMT)
- Or in the notional volumes at this time (not shown in the chart)
These trade volumes exhibit a classic pattern of a rise on market opening, tail off for lunch and high around market close. A pattern that can be observed in many markets. Also like many markets trading activity is also news driven. So on days of a Fed meeting or a key economic number or un-expected news, we would expect to see higher volumes around these times.
Another approach is to look at trades with execution times before and after 11:00 am EST and compare their prices with the ISDAFIX rate determined for that day.
You can do this in SDR View by drilling down to the trades and then sorting by ascending time and scrolling to 15:00 GMT. I have done this for 11 randomly chosen dates in 2013.
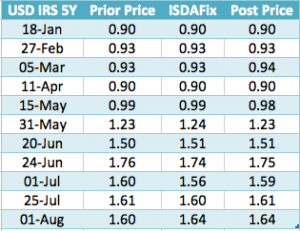
What can we observe from this:
- Generally the trade just prior to 11:00 and just post 11:00 are within 1 basis point of the ISDAFIX.
- On 3 days in our sample of 11 there is a 1 bps difference
- On 2 days there is a difference of 4 bps (01-Jul and 01-Aug)
So interesting but not 100% conclusive. Lets not forget that 1 basis point my be the difference between a Swaption being in the money or out of the money, so 4 basis points is significant. However lets also not forget that the ISDAFIX process includes topping and tailing of contributed quotes, which could easily explain the 4 bps difference.
Well we need to do more investigation.
The mind is willing but the flesh is weak.
Or more accurately lacking in monetary incentive.
Anyone willing to pay hourly rates?
If not, I leave the curious to do their own random or systematic checks using SDR View.