 When visualising a yield curve in an application, graphing the discount factors is rather pointless, graphing the zeros is not much better as they are average rates, capable of hiding all manner of problems. It is really the forwards that are most interesting, kinks and twists can point to problems in market quotes or the curve building algorithm itself. Naturally the question arises,
Which forwards should be given to the graphing library?
In the past I have been lazy, just computing forward rates on every day over the entire term of the curve and then passing them all to the graphing library. This ensured every kink and twist is graphed and allowed me to zoom into problem areas with confidence. However, with long dated curves, this can start to become a problem for the graphing library; at 50Y there are over 18000 points, which is much more than the number of pixels available on the average screen. Whilst some graphing libraries are fine with this number of points, google’s charting library is not, so I decided not to be quite so lazy and reduced the number of points sent to the graphing library.
The first step is to decide which date is the last date to be graphed. If the curve object permits extrapolation, it is very useful to graph points beyond the last date on the curve, as it can then reveal any (accidental) discontinuity at the end of the original curve.
The next step is to identify the kinks and discontinuities in the curve, if there are any. Often these points are known, a priori, if one is in control of the curve stripping routine, however I also considered the case of importing a discount factor curve described only by a list of daily discount factors, in which case, I needed to find the kinks and discontinuities numerically. The neighbourhoods of such points are of great interest and so they should be added to the graph as a priority.
The final step is to consider the regions that are smooth. A piece-wise linear function can usually be found which has a very tight approximation to the original curve, yet has many less data points. I am not suggesting such a reduced curve could be used for pricing, but merely for graphing.
In many of the cases I have tested, the curve can be reduced to less than 500 points and yet have enough detail to be useful for graphing. In the following examples I have assumed that the discount factor curve is imported from a list of discount factors and so the kinks and discontinuities are found numerically.
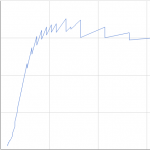
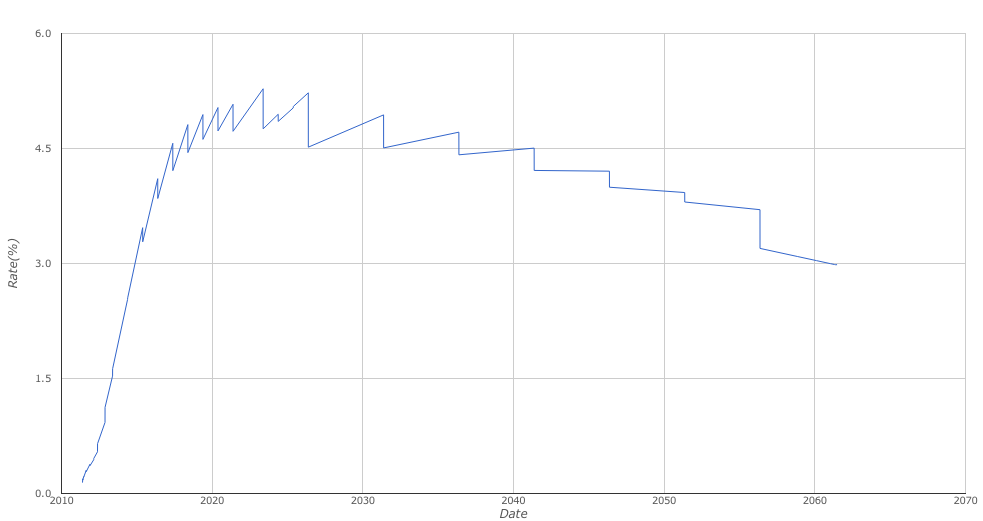
In this first example, the curve is deliberately constructed using linear-on-zero interpolation, leading to ‘jaggy forwards’. The curve in blue has 17696 points, the curve in red has 87 points (50bp is added to the create the red curve, so that it can be distinguished in this graph)
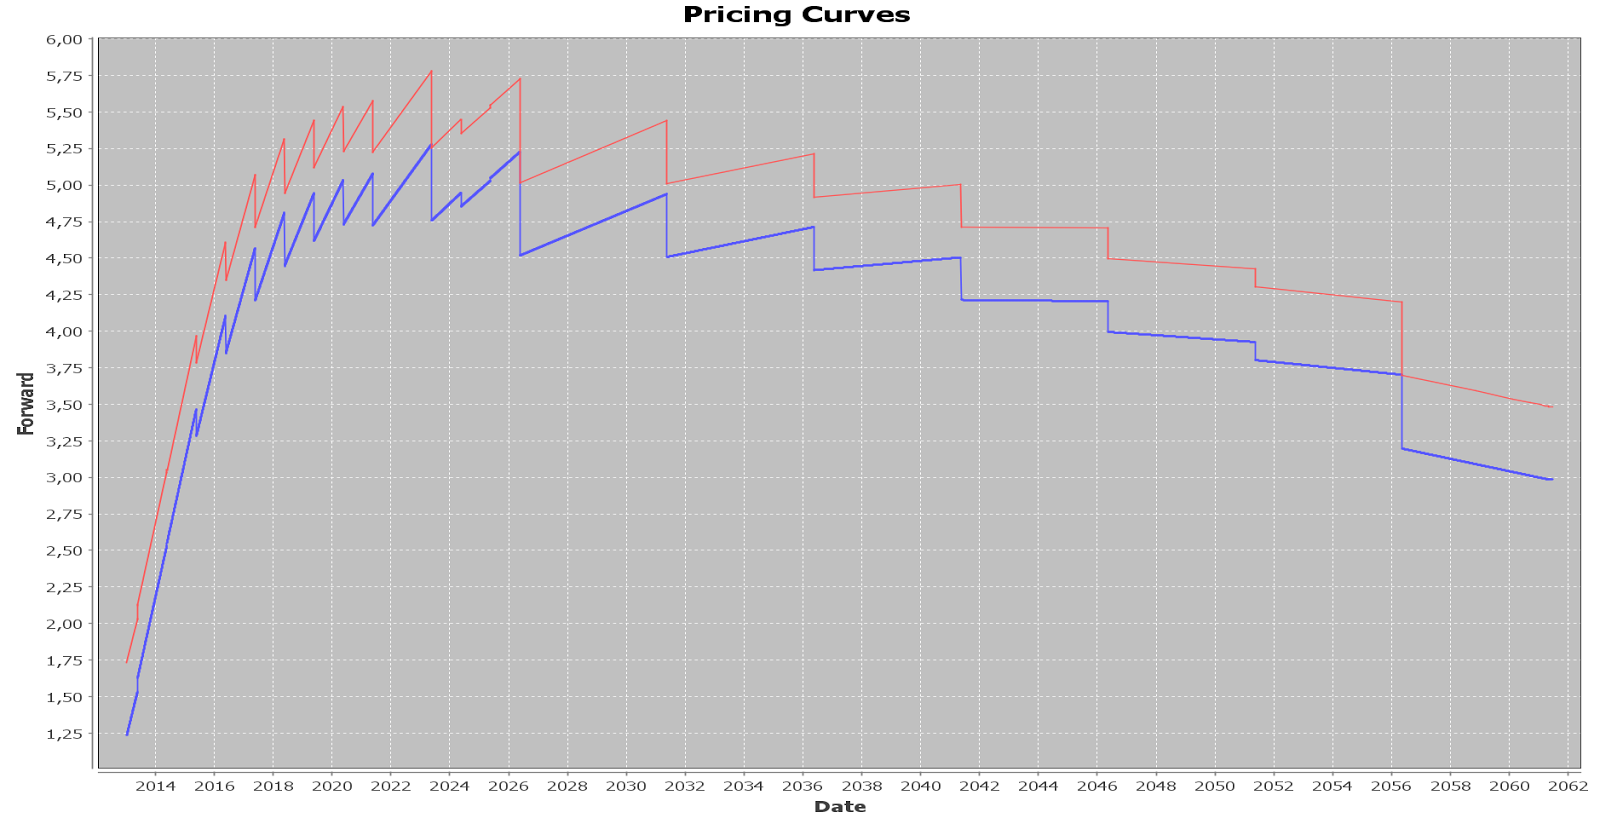
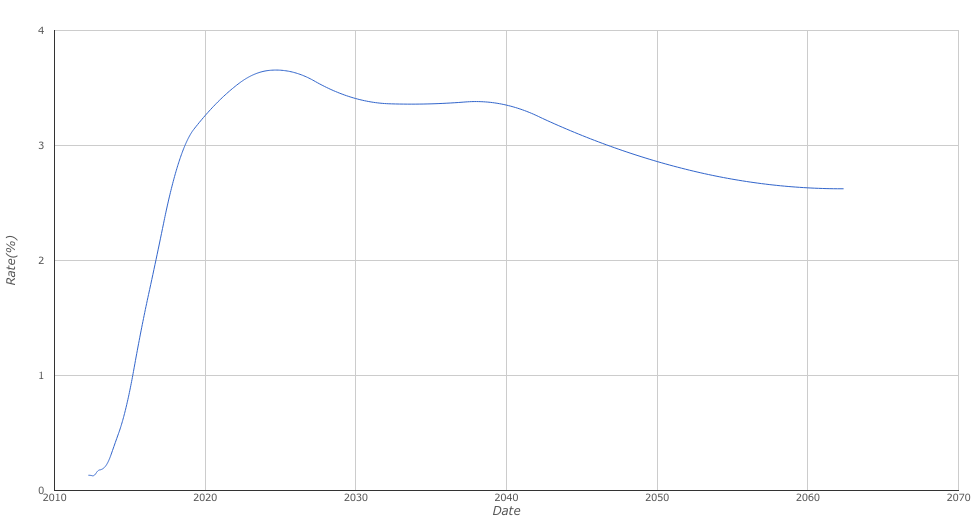
The next example considers curves built with modern curve builders that have smooth forward interpolation routines. The blue and yellow curve are the 6M forecast curve and the associated OIS discount curve, each with approximately 18000 points. The red and green curve are the same curves approximated with just under 500 points and again shifted by 50bp to distinguish them in the graph.
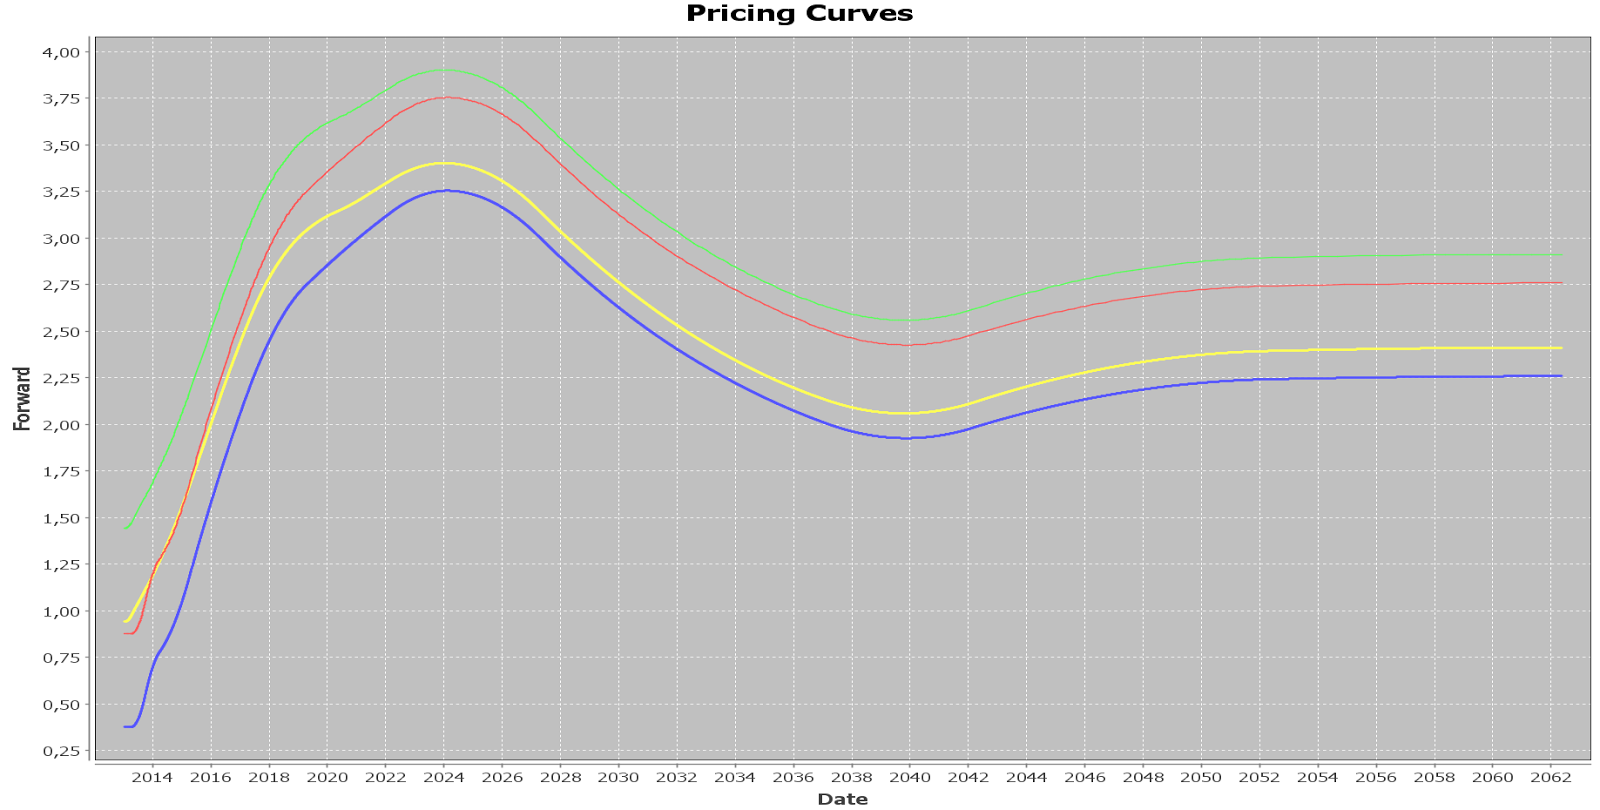
Under magnification (and removal of the additional 50bp) one can see how the curve is being approximated, there is less than 1/100th of a basis point between the approximate curve and the original curve.
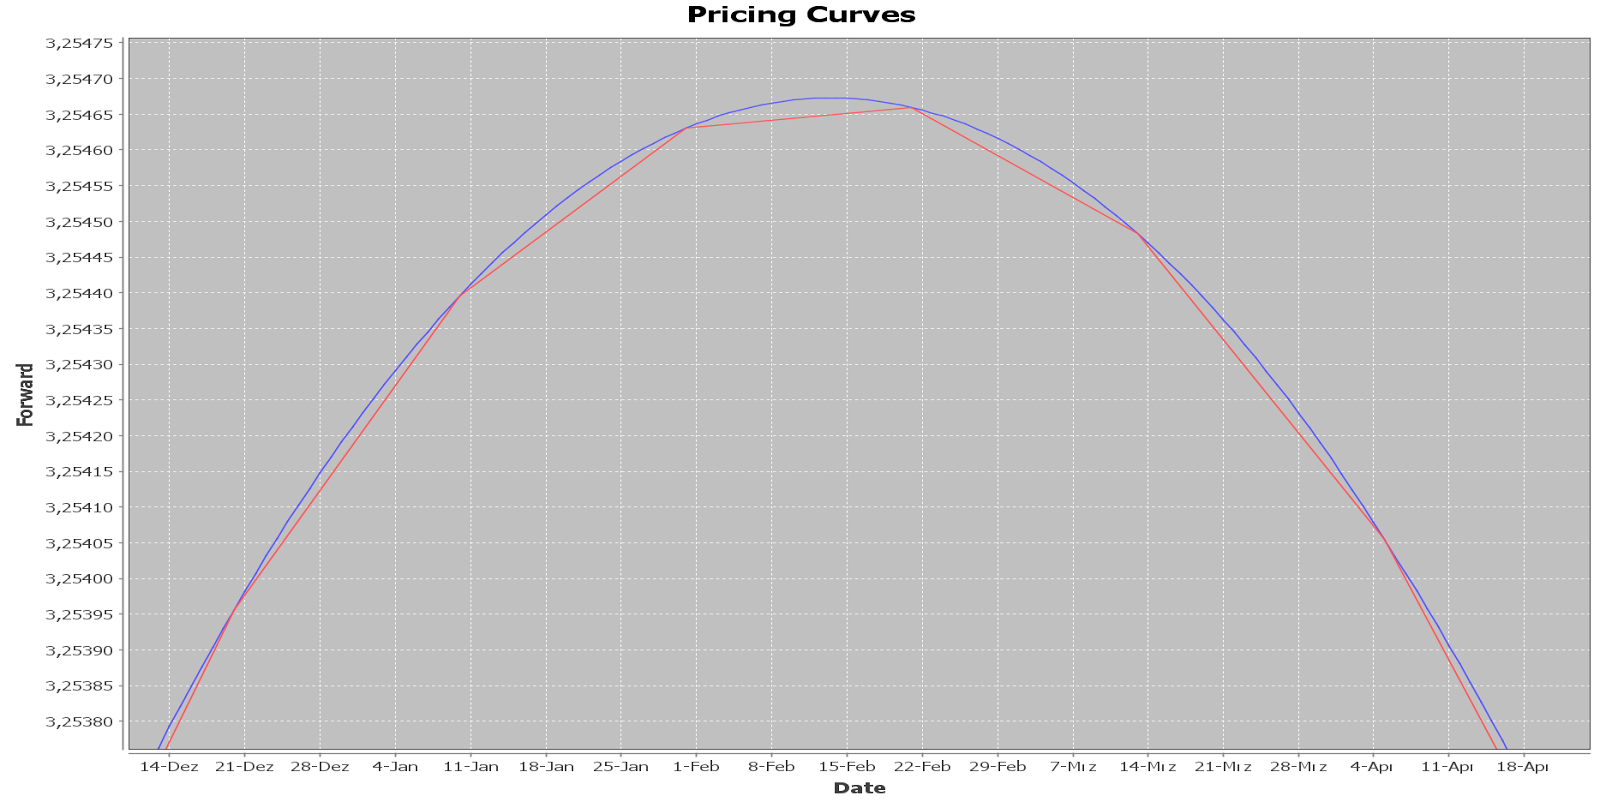
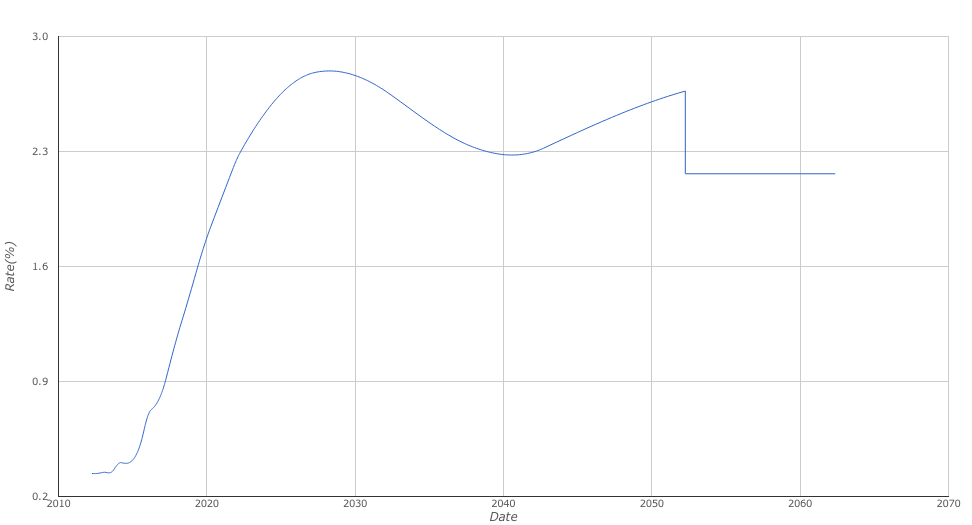
The final example is a curve with smooth forward interpolation, but one discontinuity created by extrapolating flat-on-zeros rather than flat-on-forwards. Again 50bp is added so that the curve may be distinguished in the graph.
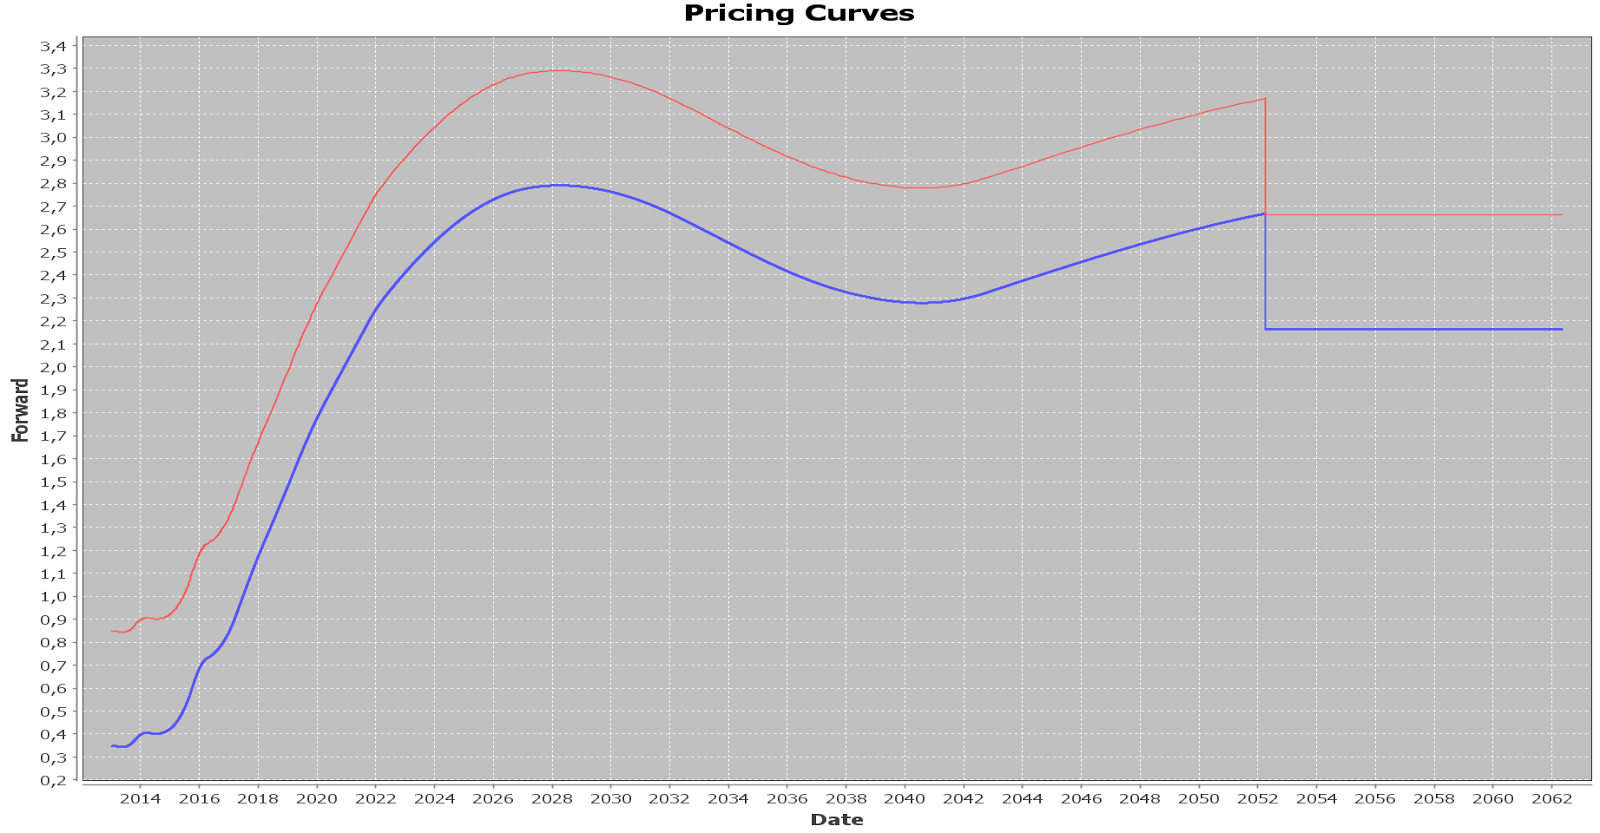
Similar curves with only a few hundred points are shown in google’s graphing library. The algorithm works well and produces graphs that can be resized and redrawn quickly in the browser.
Update 23 Jan 2012: Ramer-Douglas-Peucker Algorithm seems to be a useful place to start when considering existing algorithms in this area.