- We look at the percentage of notional and risk that is traded as an OIS swap across six currencies.
- 55% of GBP trading activity when measured by risk (DV01) is currently transacted versus SONIA (OIS).
- Just 16% of USD trading activity is transacted as an OIS when measured by risk.
- AUD markets are leading the way in OIS trading with 69% of risk transacted as an OIS.
- All measures are calculated using tenor data from LCH SwapClear.
How Much of the Swap Market is Traded as an OIS?
This week, I will update two previous blogs on OIS trading:
- August 2018, How Much Of The Swaps Market Is Traded As An OIS?
- April 2018, OIS Volumes – What is the Trend?
It’s worth reading those to get a bit of background to the following analysis, but I have also chosen to follow a slightly different methodology this time round.
Notes on the Methodology
- The data below is all from CCPView, looking at IRS, FRAs and OIS cleared at LCH SwapClear.
- The data is therefore for the global cleared market.
- Maturities are bucketed into 2y, 5y, 10y, 30y and 50y tenors.
- ‘IBOR exposure is calculated for IRS and FRAs.
- Basis swaps (‘IBOR vs OIS) are excluded as these would add equally to each index.
- RFR exposure is calculated for OIS. I have not split the OIS trades by index for EUR (between EONIA and €STR) and USD (between Fed Funds and SOFR). Let’s assume a switch from one overnight index to another will be much simpler than a switch from term ‘IBOR to RFR. Therefore I am taking overall OIS exposure as a proxy for RFR trading for now.
- I was initially hesitant to include FRA exposures in the ‘IBOR calculations. For GBP, USD and EUR they really change the percentages. However, given that so much OIS exposure is short-dated, I felt compelled to also include short-dated ‘IBOR FRAs in the calculations.
- DV01s are calculated using our ParDV01 Microservice, converting the tenors into a maturity-agnostic measure of risk.
That stated, let’s take a look at the results.
GBP – SONIA trading in the United Kingdom
GBP markets seem to be leading the push towards RFR trading – see our recent blogs on SONIA below:
Ahead of my upcoming Live Blog on SONIA-transition day (one month away, 2nd March 2020) I thought I should get a proper handle on how SONIA trading is currently performing.
With all of the short-end activity that has happened this month, we can see that January 2020 has an impressive record for SONIA trading:
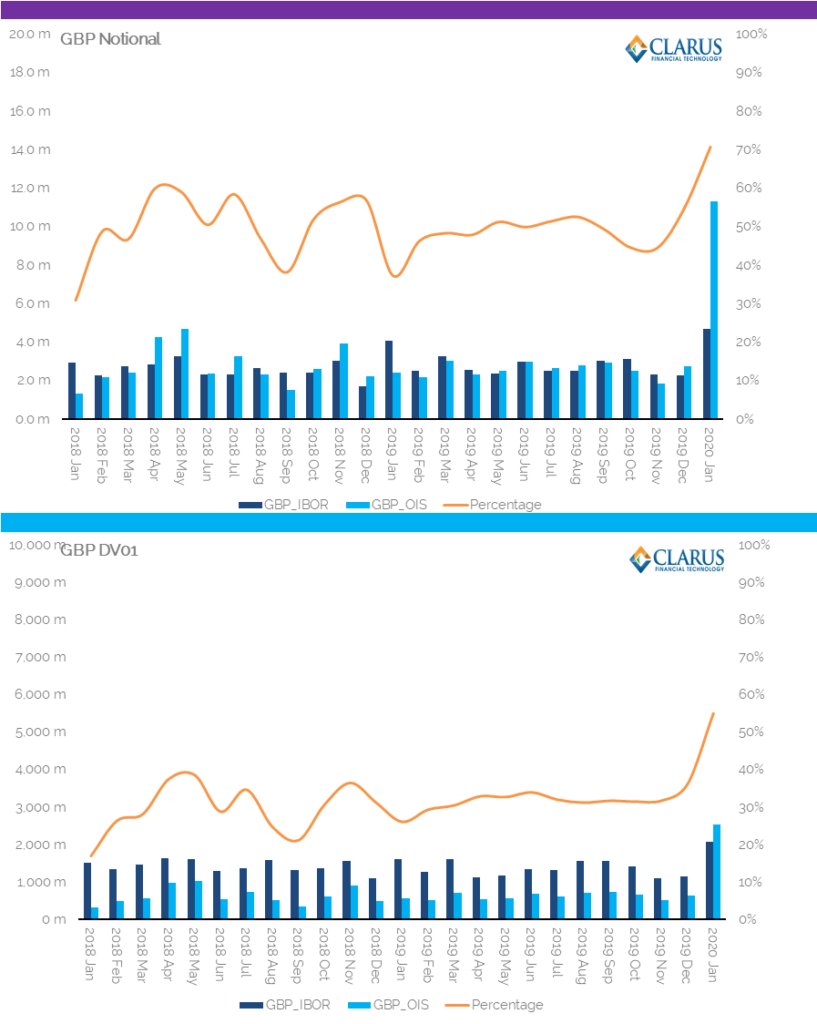
Showing;
- 71% of trading activity, as measured by notional, was transacted versus SONIA in January 2020. This was up from a consistent 48% average in 2019.
- 55% of trading activity, as measured by DV01, was transacted versus SONIA in January 2020. This was up from 32% during 2019 and really accelerated the trend higher.
- January 2020 saw both the largest amounts of notional and the largest amounts of risk traded for at least two years in GBP swap markets.
- With the market convention shifting to SONIA swaps from March 2nd 2020, this trend is a very positive sign for RFR trading.
USD – Fed Fund and SOFR trading in the US
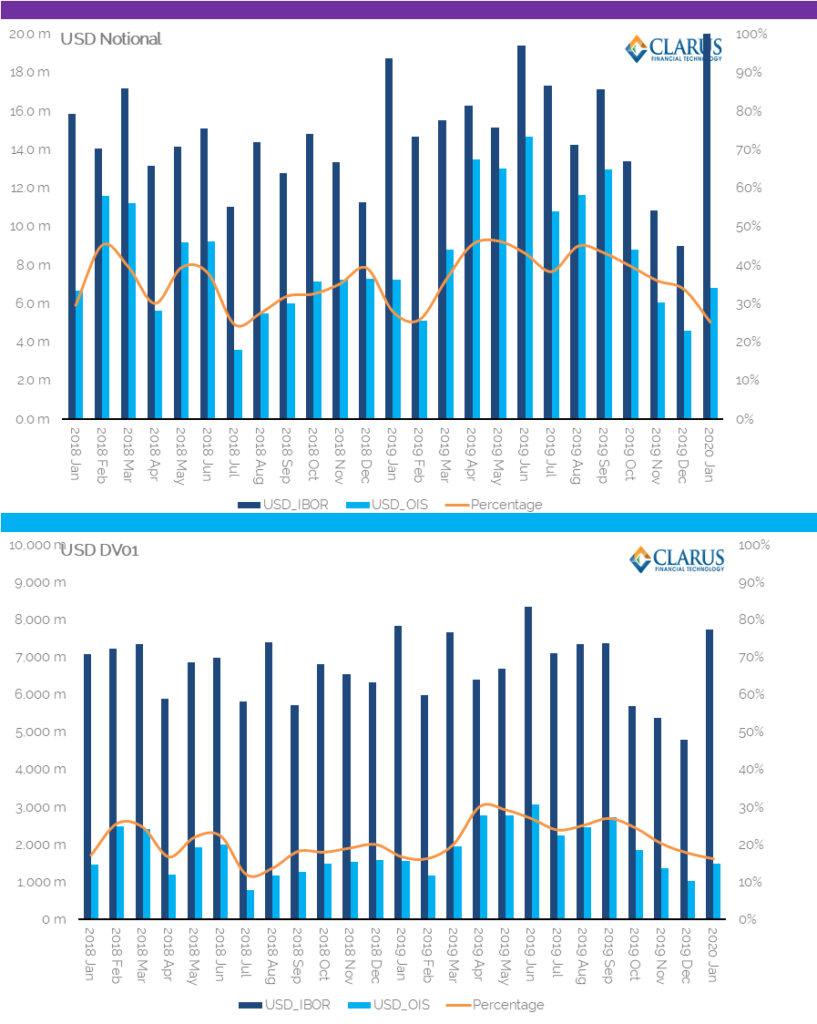
Showing;
- 25% of trading activity, as measured by notional, was transacted as an OIS in January 2020. Most of this is versus Fed Funds. This was lower than every month during 2019.
- 16% of trading activity, as measured by DV01, was transacted as an OIS in January 2020. This was as low as any month in 2019 and shows no sign of picking up.
- January 2020 saw the largest amount of notional transacted versus USD LIBOR for two years. Not a great transition story.
- However, the chart does not take into account trading versus Fed Funds or SOFR futures. We can run that quickly using the RFR analysis in CCPView:
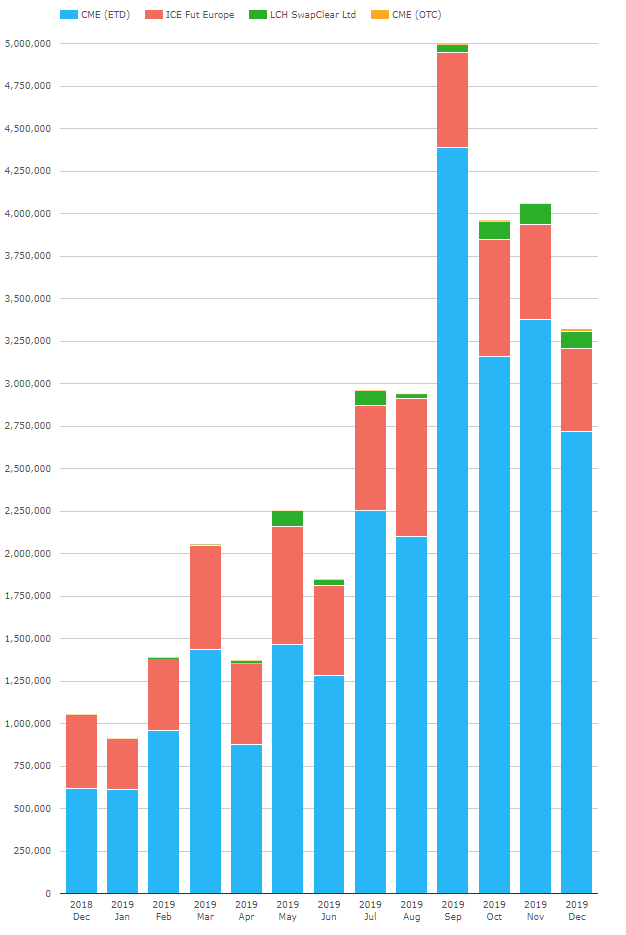
- The chart shows that overall volumes have indeed dipped since September in SOFR products. Whilst November was the record month for volumes in SOFR swaps, this wasn’t the case across all products.
- The analysis shows that USD markets are a long way from transitioning away from LIBOR.
EUR – Eonia and €STR trading in Europe
€STR trading is still in its infancy (I think we’ve only seen €STR trade as an IRS at LCH so far, no futures yet). Cumulative volumes of €STR swaps in 2019 were about €175bn.
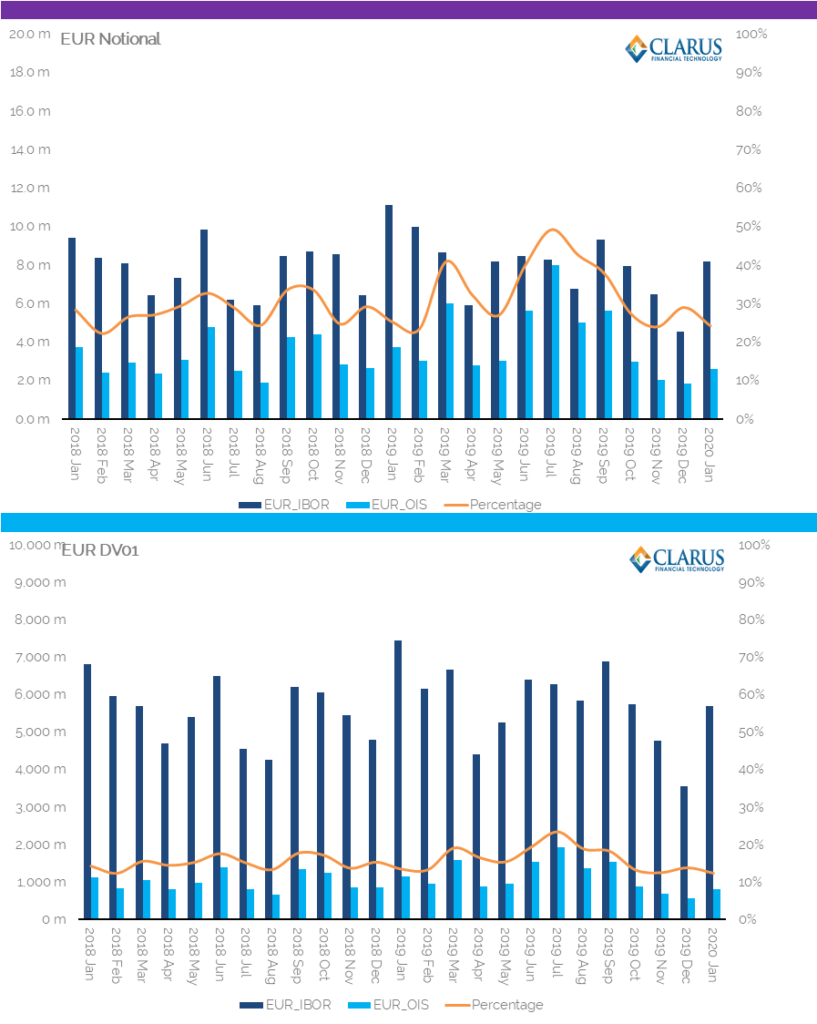
- 24% of trading activity, as measured by notional, was transacted versus EONIA in January 2020. This was lower than the 33% average in 2019.
- 12% of trading activity, as measured by DV01, was transacted versus EONIA in January 2020. This was down from a 16% average during 2019.
- There are no signs that the EUR market is moving toward an OIS standard.
- This is maybe not surprising given that EURIBOR has received a “stay of execution” and is likely to be around for another 5 (?) years at least.
- However, given that EUR markets enjoy an active long-end OIS market already, it is somewhat surprising that OIS trading isn’t more prevalent in this environment.
JPY – Tonar trading in Japan
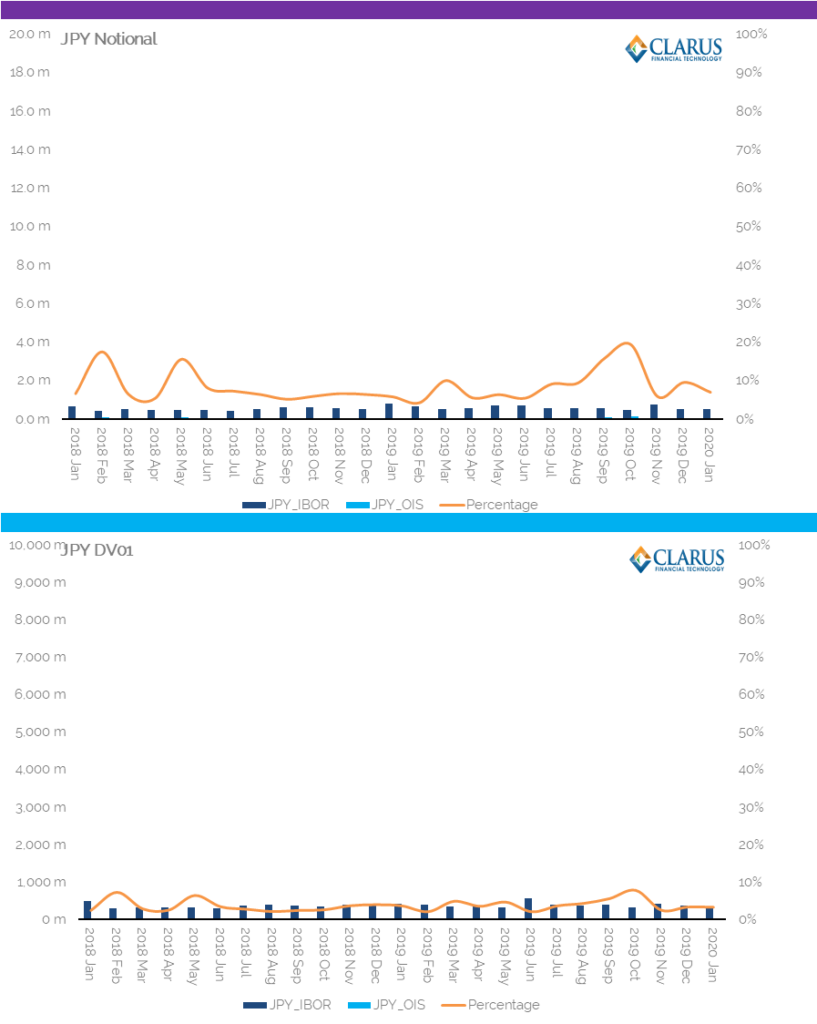
- 7% of trading activity, as measured by notional, was transacted versus TONAR in January 2020. This was lower than the 9% average in 2019, but it was as low as 4% back in February 2019.
- 3% of trading activity, as measured by DV01, was transacted versus TONAR in January 2020. This was in line with the 4% average during 2019.
- There are no signs that the JPY market is moving toward an OIS standard, and the small amount of risk traded versus TONAR shows that it remains a very short-dated market.
- There seems to be a lot of work to do in JPY markets to transition away from LIBOR.
- Note that the scales are kept constant on all charts, highlighting how much larger GBP, USD and EUR swap markets are than other currencies.
AUD – AONIA trading in Australia
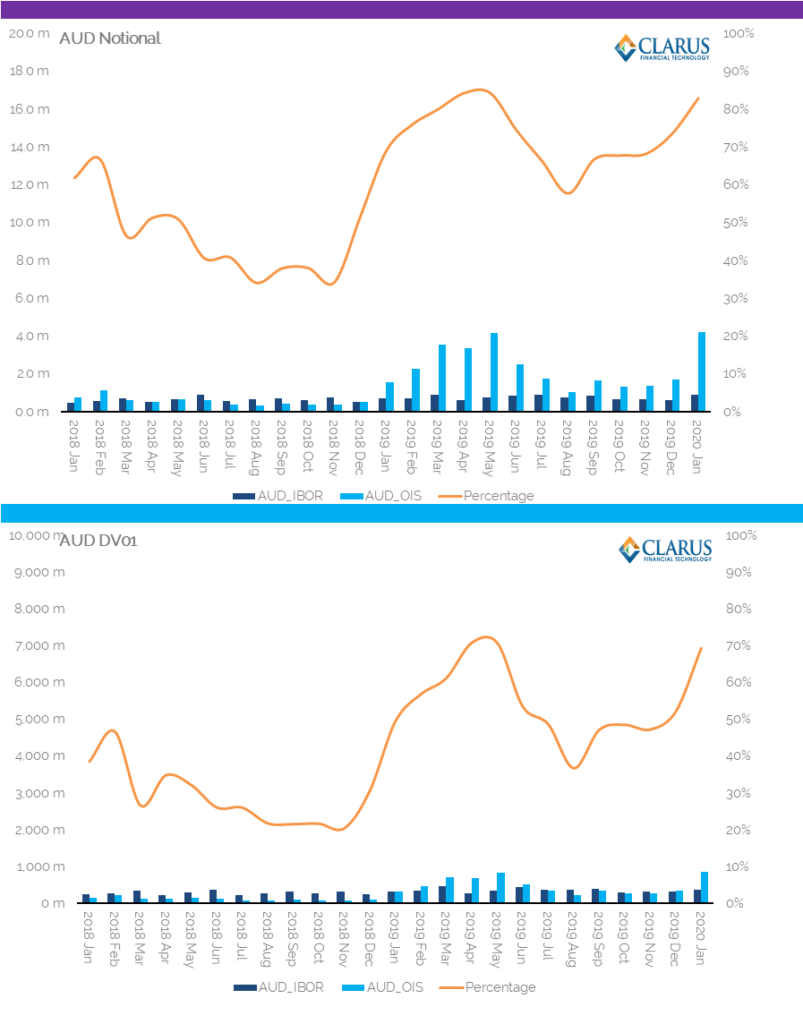
- 83% of trading activity, as measured by notional, was transacted versus AONIA in January 2020. This was higher than the 72% average in 2019.
- 69% of trading activity, as measured by DV01, was transacted versus AONIA in January 2020. This was much higher than the 54% average during 2019.
- AUD markets seem to be rolling toward a new standard all by themselves. Maybe this is all down to short-dated RBA-related hedging, but at the moment AUD markets are setting new standards as to how much risk can be transacted as OIS products.
- It is worth noting that the global market, as cleared at LCH SwapClear, shows substantially different results to those trades reported by US Persons to SDRs.
CAD – CORRA trading
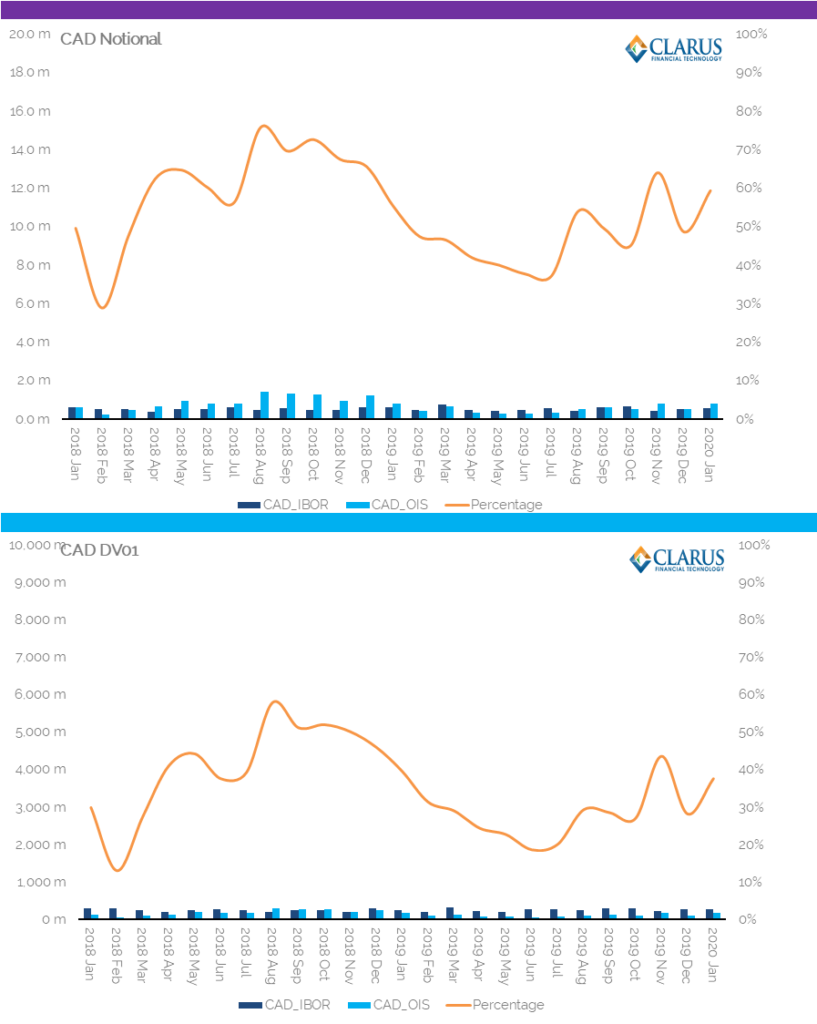
- 59% of trading activity, as measured by notional, was transacted versus CORRA in January 2020. This was higher than the 47% average in 2019.
- 38% of trading activity, as measured by DV01, was transacted versus CORRA in January 2020. This was much higher than the 29% average during 2019.
- CAD markets show a high percentage of activity versus OIS. This is even before an Enhanced CORRA is published, which may encourage even more activity.
In Summary
- There are huge differences between markets in the relative amount of OIS trading.
- GBP markets see 55% / 71% (risk/notional) transacted as an OIS.
- USD markets see 16% / 25% transacted as an OIS.
- EUR markets 12% / 24%.
- JPY 3% / 7%.
- AUD really stands out at 69% / 83%.
- CAD also setting a good standard at 38% / 59%.
- ‘IBOR transition still has a long way to go.
- All eyes on the SONIA transition date on 2nd March 2020. Tune-in for our live blog on that Monday morning.