Those of you that read my previous post on the Block Trade Rule will know that on July 30th we moved from the Interim period to the Initial period.
This means two significant changes, firstly that the public dissemination of all trades is no longer delayed by 30 minutes, only block trades are delayed and secondly that the capped notional sizes for block trades are significantly increased.
This article deals with the impact of the capped notional increases.
So lets start with an SDR View chart of USD IRS Daily Volumes for the previous six days.
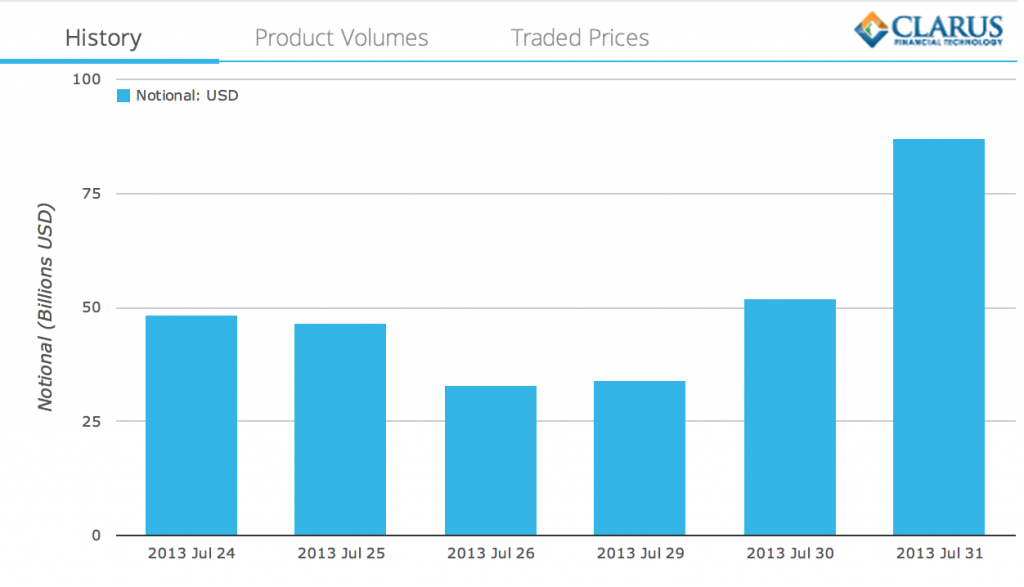
Looking at this you may draw the conclusion that there was a jump in volumes on July 30 and July 31.
In reality a large portion of this increase is down to the increased capped notionals being reported from Jul 30 onwards. Can we say how much is due to the new rules and how much to higher trading volume?
We need to start by looking at the detail of the rules as they were and as they now are:
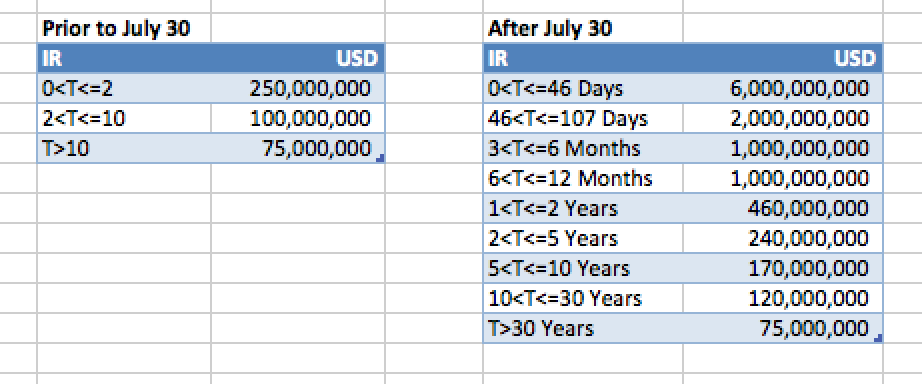
(These are available from the Cap Number report available for each day from the DTCC DDR dashboard).
As an example for a 5Y IRS the reported notional is increased from a maximum of $100m to $240m. So a very substantial increase.
The question is what does this mean for the volumes we have in SDR View, both prior to 30 July and after 30 July. One way to understand the effect is to look at the number of trades that are now reported as Capped on 31 July and work out how many would have been Capped if we applied the old rule to these. I have done this for the major tenors in USD IRS as below.
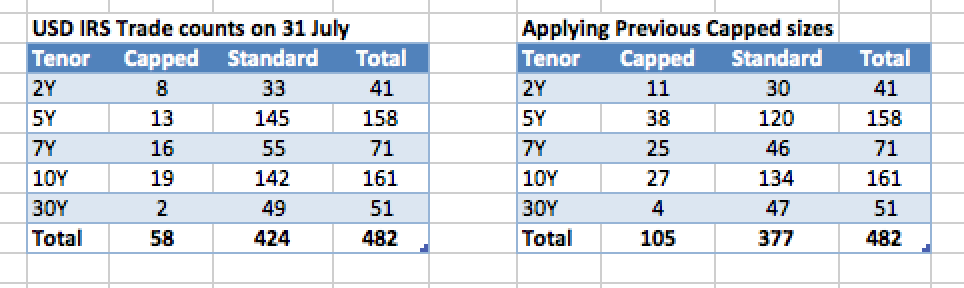
From this we can see that there is now a significant reduction of capped trades. So the rules existing prior to 30 July would have capped 105 trades on 31 July, but the new rules have capped just 58 trades.
Now the real question is what does this mean in notional terms.
Again applying a similar analysis but this time on gross notionals we get the following table:
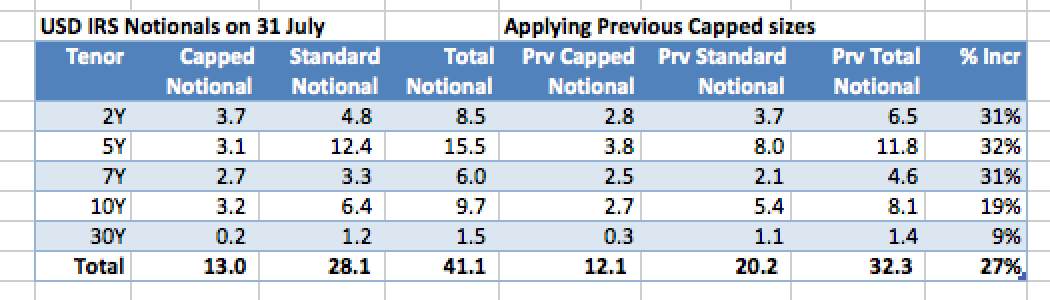
Form this we can see that the previous rules would have shown total daily gross notional volume of $32 billion, while the new rules now show this is $41 billion. So 27% higher. In-fact we know the actual volume is higher still as there are still 58 trades that are being capped below their actual size.
So lets draw some conclusions
- In my original post I stated that “the publicly disseminated total notional was being understated by between 30-55% or between $10-20billion a day.
- From the table above we can see an increase of 30% and $9 billion.
- So we can stand by the original assumption.
- This means that when comparing USD IRS volumes prior to July 30 with those from July 30 onwards, as a rule of thumb we should apply a 30% uplift to the earlier numbers.
- Also in my original post I noted that the 30% of trade where capped and these represented 57% of total notional.
- With the new rules and just looking at 31 July, we can see 12% of trades are capped and these represent 32% of the total notional. So a marked reduction.
Well, so far so good.
I have not looked at EUR, GBP or JPY, but would expect to see similar figures.
Now we just need to wait for the Post-Initial Period in Q2 2014 for another increase in trade sizes.
I leave you with the usual refrain “Keep using SDR View to follow and understand the data”.