- We supply simple code to retrieve SDR Prices into Python
- And create a streaming chart of swap prices and volumes
- The code was written by an ex-trader with no prior experience of Python
- Showing how easy it is to use the Clarus API
- Clarus continue to make swaps data more accessible than ever
Is this a Stupid Thing to do?
So I’m about to do a very stupid thing. So please read these caveats before going on:
1) I’m not a coder
2) I don’t write code for a living
3) I don’t respond well to criticism
4) I’m not a coder. Did I mention that already?
I write this blog with a background as a Swaps trader. Meaning that, over the years, I’ve had to get comfortable with VBA to master the dark arts of Excel. I was taught the very basics (15 years ago now, gulp) and the rest has been “self-taught”. And all of this was from before the days of searching for snippets of code on the internet!
What that all means is that I’m comfortable with the idea of programming, but not so much the actual execution 🙂
So last week, I set myself a challenge for the new year. Could I actually code? What follows took me less than half a day. That’s right…..less than 6 hours work is here. From scratch. My goal? To get the last traded price of a 10y USD IRS into Python.
Why Python? Because it seems to have the same following amongst our development team as Excel does amongst traders.
I’ve read enough posts on stackoverflow recently to know the pitfalls of posting amateur code up on the internet. So all I will say is that the code below worked for me, and in a flawless manner. I’m not holding this up as the right way to do this, but I do think people should know how easy this kind of thing now is.
The basic premise of the blog will be:
Some explanation of why I’m doing this will go here.
Some code goes here.
Out comes a streaming chart (eventually).
Installing Python
First go to python.org and download the latest version of Python 3.x. Then follow the instructions here to install pip. pip is one of the most useful tools I’ve ever come across. Coming from a VBA background, I think of pip as allowing me to load excel add-ins (.xla’s) into Python. And it really is the simplest thing to use. Just open Command Prompt in Windows and type in
python -m pip install
What this means is that every time you see some code on the Internet that has “Import” at the top of it, you just need to make sure you’ve previously run “python -m pip [name of Import package] install” in your Command Prompt. These so-called “Packages” (a.k.a excel add-ins in my trader view of the world…) simply give you access to a whole host of functions in Python.
That’s the tough bit over
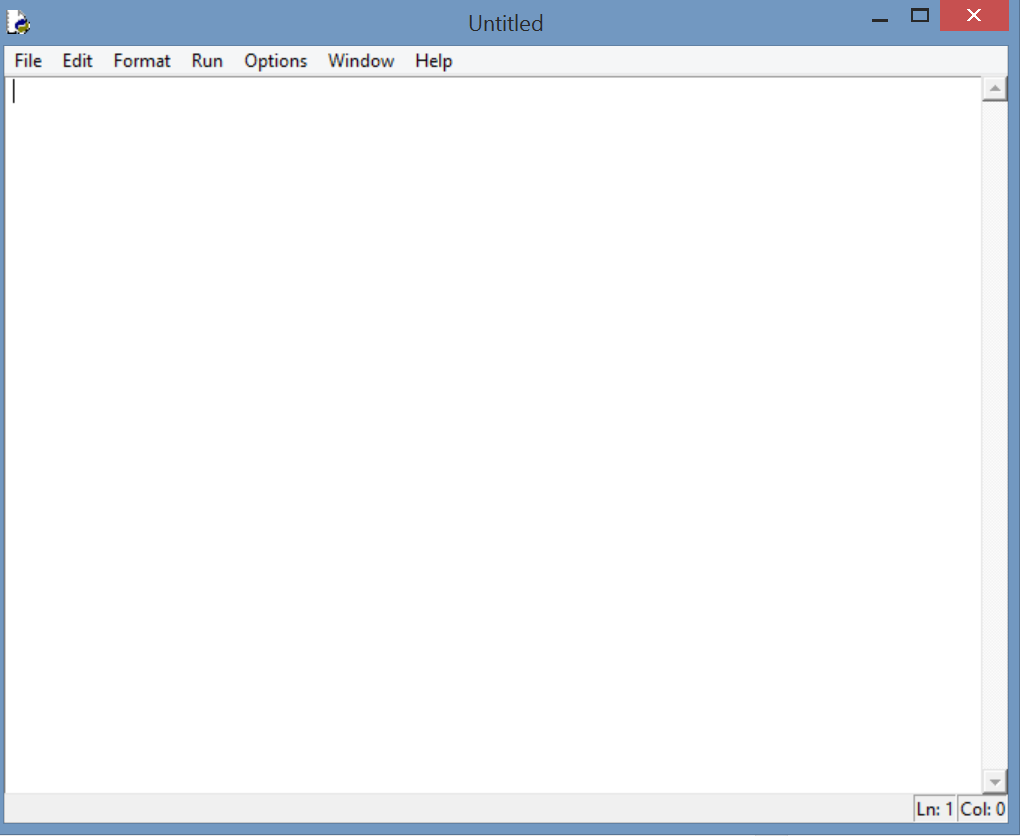 We’ve probably covered most of the faff now. All you have to do is open “IDLE” and you’ll see a nice blank screen, that looks suspiciously like notepad. From my previous experiences, this is where it can all get a bit daunting. It’s just a bit too blank canvas for my liking. Fortunately, we can just copy and paste code into this window and run it. So that’s where the next bits come in.
Arm yourself with an API Token
We’ll be hitting up the Clarus API in Python. That means two things:
- You’ll need a Clarus token. This will authorise you to use our API. Contact us, log on here or send your username and password directly to our API (see below).
- Don’t freak out at the mention of an API. It just means Clarus will be sending you our data once you ask for it.
REST APIs
I have experience of calling REST APIs from Excel, and it is slow and painful. REALLY slow. I was worried about similar issues in Python, but this just isn’t the case. It really is a great example of using the right tools for the job. First, we need you to authenticate yourself as an active Clarus subscriber. This is done using 1 line of Python code (plus the definitions of what we send and to where):
import requests
import json
import sys
import time
import base64
############################################################################
## Example of API authenticate to SDR Res
##
## Sends Username and Password, returns API Access Token
##
############################################################################

print (sys.version)
username = "[email protected]"
password = "I'm not stupid enough to put that on a blog"
url = "https://sdrview.clarusft.com/rest/auth/apiauth"
startClock = time.time()

r = requests.post(url, data = {"username":username, "password":password})
I’m guessing you’ve already gone ahead and copy and pasted that, saved and hit run. This will probably not work for two reasons:
- You forgot to run pip on all of those “import” packages at the top.
- You need to change the username and password to your own Clarus ones 🙂
What is happening here is surprisingly simple: “r=” is the request that we are sending to the Clarus API, using a function called “post” that is part of the “requests” package that you’ve just installed using pip. Clever, eh? From this, you wont see much happening in your IDLE window (apart from any errors you’ve just encountered!). That’s because so far, we’ve only told the code to show (“print”) the system version. So let’s see what this “r=” actually returns. Below your “r=” line of code, copy and paste the below:
endClock = time.time()

if r.status_code == 200:
  s=json.loads(r.text)
  apiToken = (s["apiAccessToken"])
  s=json.dumps(s, sort_keys=True, indent=2)
  print (s)
  print (apiToken)
else:
  print (r.status_code)
  print (r.text)
print ('Time (ms)', (endClock-startClock)*1000)
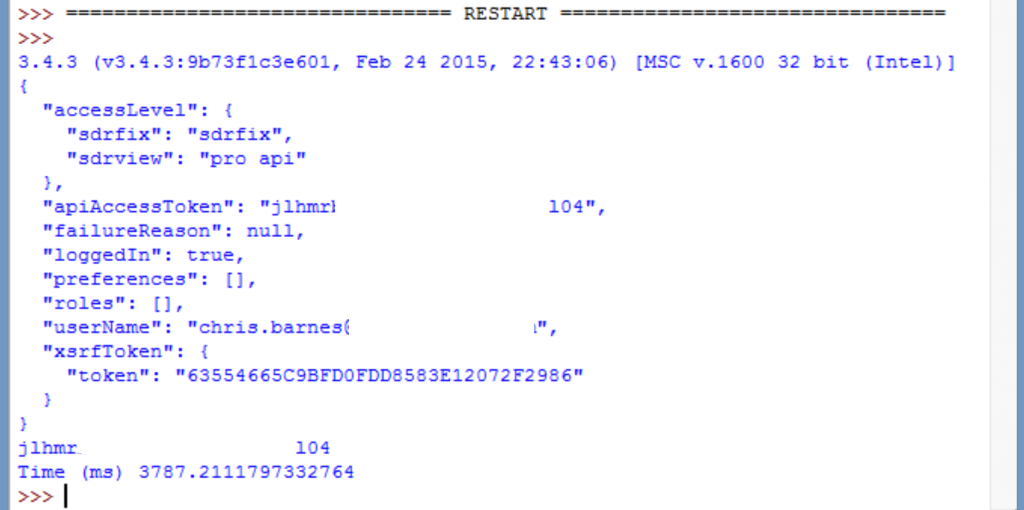 We are now telling Python to return the output of the REST API call (simply denoted “s”) and, from that indexed data (because it’s returned in “JSON” format) we can also directly return “named fields”. Such as the apiToken we are looking for. Hence your IDLE screen should now look something like the screenshot to the right (with access tokens not blanked out!).
Essentially that is it
Now that we can do a Post call (i.e. sending data) , we can also do a Get call (i.e. retrieving data) to the API. It’s just a case of defining the parameters that our API expects and sending them via “requests” in Python. So here, we’ll ask the Clarus API for “Prices”.
# Access Clarus SDR for LastPrice of 10Y USD IRS Swap

url = "http://sdrviewrt.clarusft.com/rest/api/prices.json"
token = apiToken
date = (time.strftime("%Y-%m-%d")) #Clarus formatting of current date
taxonomy = "interestrate:irswap:fixedfloat"
currency = "USD"
underlyingasset = "USD-LIBOR-BBA"
reset = "3M"
venue = "On"
swaptype = "Spot"
fixedfrequency = "6M"

payload = {"token" : token, "date" : date, "taxonomy" : taxonomy, "currency" : currency, "underlyingasset" : underlyingasset, "reset" : reset, "venue" : venue, "swaptype" : swaptype, "fixedfrequency" : fixedfrequency}
r = requests.get(url, params = payload)

if r.status_code == 200:
    SDRlastprices=json.loads(r.text)
    SDRlastprices=json.dumps(SDRlastprices, sort_keys=True, indent=2)
else:
    print (r.status_code)
    print (r.text)

#Now play around with the text string to find the fields we are looking for

tenorOfswap = (SDRlastprices.find("10Y"))
priceOfswap = (SDRlastprices.find("lastPrice", tenorOfswap-200))
timeOfswap = (SDRlastprices.find(",", priceOfswap))
lastpriceOfswap = (SDRlastprices[priceOfswap+12:timeOfswap])
print (lastpriceOfswap)
I hope those last 5 lines of code are clear. I find the exact field I’m interested in from the text output of the API call. I’m sure there is a better way to do that, but I thought I would follow an “excel” like way of using “Find”, “Mid”, “Len” etc text-handlers to draw a parallel between what I am used to using (Excel) and what it looks like in Python.
Don’t be underwhelmed!
After copying and pasting the above code, you’ll now be getting the last 10Y USD Swap price into a Python IDLE window every time you run the code. Pat on back etc. But this is now where it gets really fun:
- Looping the “prices” part of the code creates a ticker on your desktop.
- Searching for “notional” gives you the total volume traded and the last volume traded.
- You can now access other APIs….
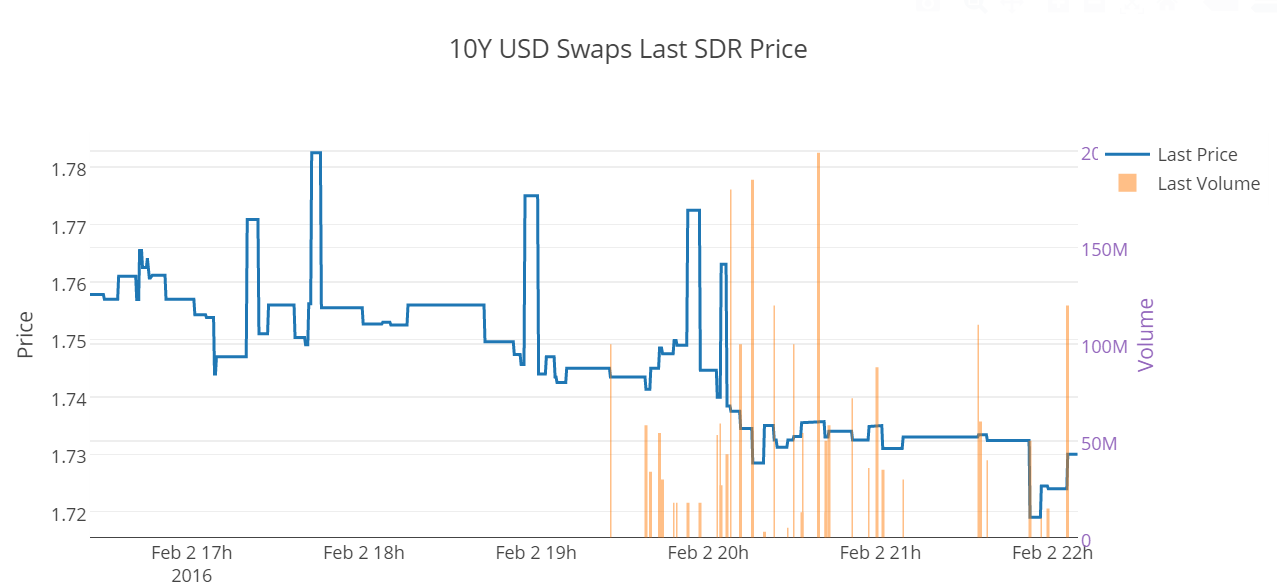
So I did all of that and sent the Clarus 10Y price and volume data to the plotly API using this code. Plotly is a free on-line charting tool that I am coming to use more and more. Mainly because it is super easy to use and covers some of the missing data visualisation tricks that I wish were in excel.
Hey presto, a trader with limited skills can produce the below. Which is pretty damn cool!
In Summary
- We provide Python code to access the Clarus API and retrieve the last traded swap price
- The data coming to the API is already curated and “cleansed” by Clarus, ensuring a clean data feed
- This code can then be looped to create a streaming feed of last SDR prices
- Which can then be used to send to other APIs to create easily accessible charts. Just try that plotly chart on your phone!
ETA: How to find data in the JSON!
It didn’t take long in our office to get some better code as to how to locate lastPrice and notional in the JSON. Here is the far more elegant version:
if r.status_code == 200:
   respJson = r.json()

   if 'items' in respJson:
       for item in respJson['items']:
           if item['tenor'] == '10Y':
              print("Last: "+str(item['lastPrice']))
              print("Total: "+str(item['notional']))
else:
   print (r.status_code)
      print (r.text)