Now that the first weeks trading after Made Available to Trade determination for Interest Rate Swaps on 15-Feb-2014, is over, I will look at what the data shows.
80% or 35%?
First a brief digression.
Risk.net on 20 Feb 2014, published an article Cleared US dollar swap volumes drop 80% on first day of Sef regime (subs req.).
This article took the headline 80% drop figure between Feb14 and Feb18 from the ISDA SwapsInfo site.
It also quoted our figures as showing a much smaller drop, $43b to $28b (for cleared spot starting swaps).
Which is a 35% drop.
Now what is the difference between 80% and 35%?
Well 80% to me means a market that has dropped massively and is barely functioning.
While 35% is within the normal day to day change in activity from one day to the next.
We pointed this out to Risk and I am pleased to say that on Friday SwapsInfo changed their figures and now show a 31% drop.
So reasonable agreement, given the difference in methodology (e.g. EOD 4pm EST, while we use EOD 7pm EST).
As the Risk.net article has been referenced by lots of sites and newsletters; I hope the 80% figure will be publicly corrected.
(Feb 25 Update, see comments below from Duncan Wood, Editor of Risk)
Week One vs prior Week
Now on to the data, starting as always with a chart.
Daily Volume for All Cleared USD IRS (fixed vs float, whether spot, forward, imm, spreads, packages, …)
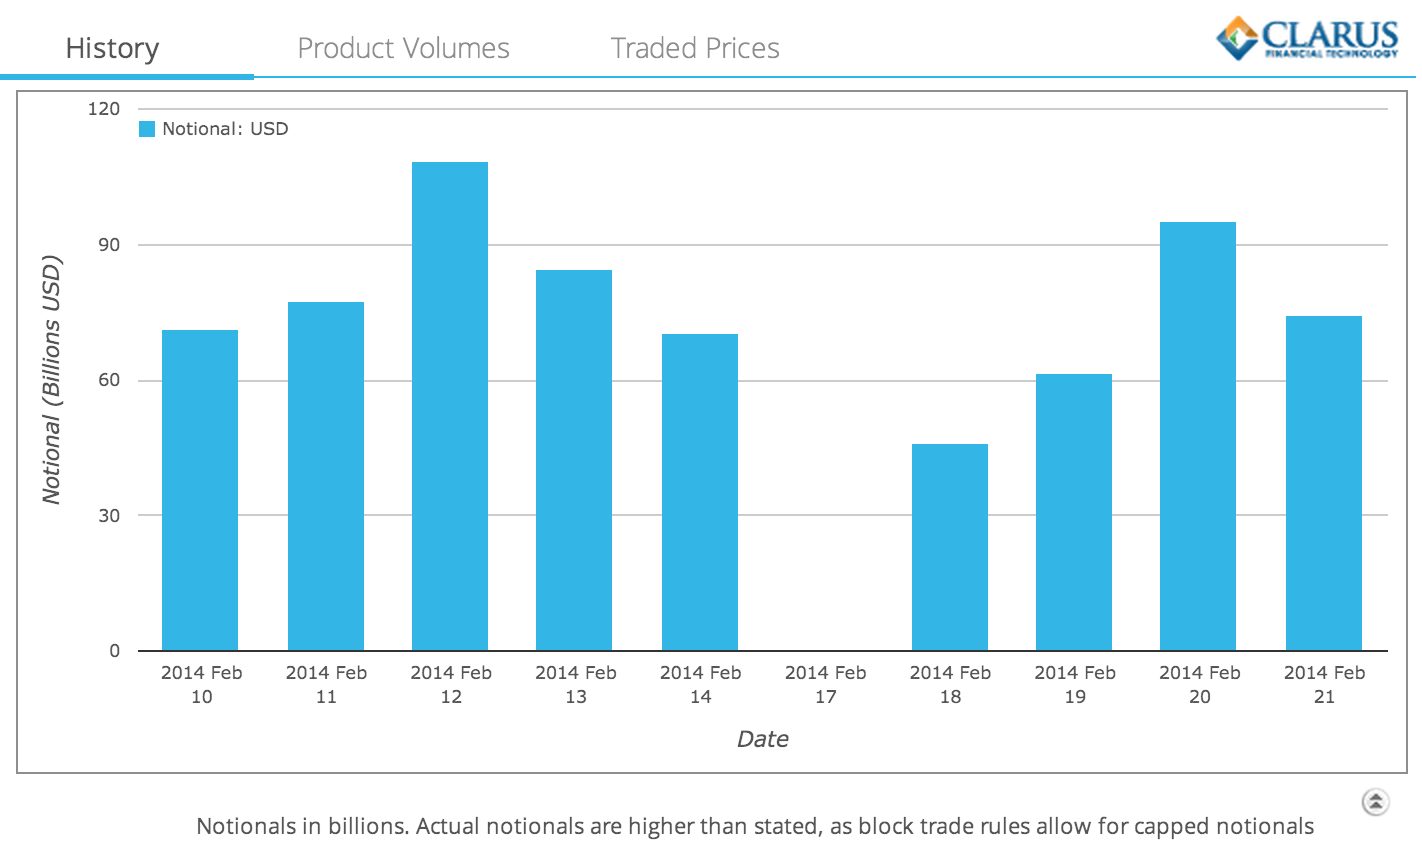
From which we can see that:
- Week starting Feb 10, $71b, $78b, $109b, $85b, $71b on each day
- Week starting Feb 17, $0b, $46b, $61b, $95b, $74b on each day
- Feb 17 was a holiday
- (remember the $43b & $28b figures in the previous section for Feb 14 & Feb 18 are for spot starting swaps only)
- Comparing these two weeks, we can say that there was a slow start on Feb 18
- However since then volumes are similar to the daily volumes of the prior week
Lets now look at the same chart, but filtered just for On SEF Swaps.
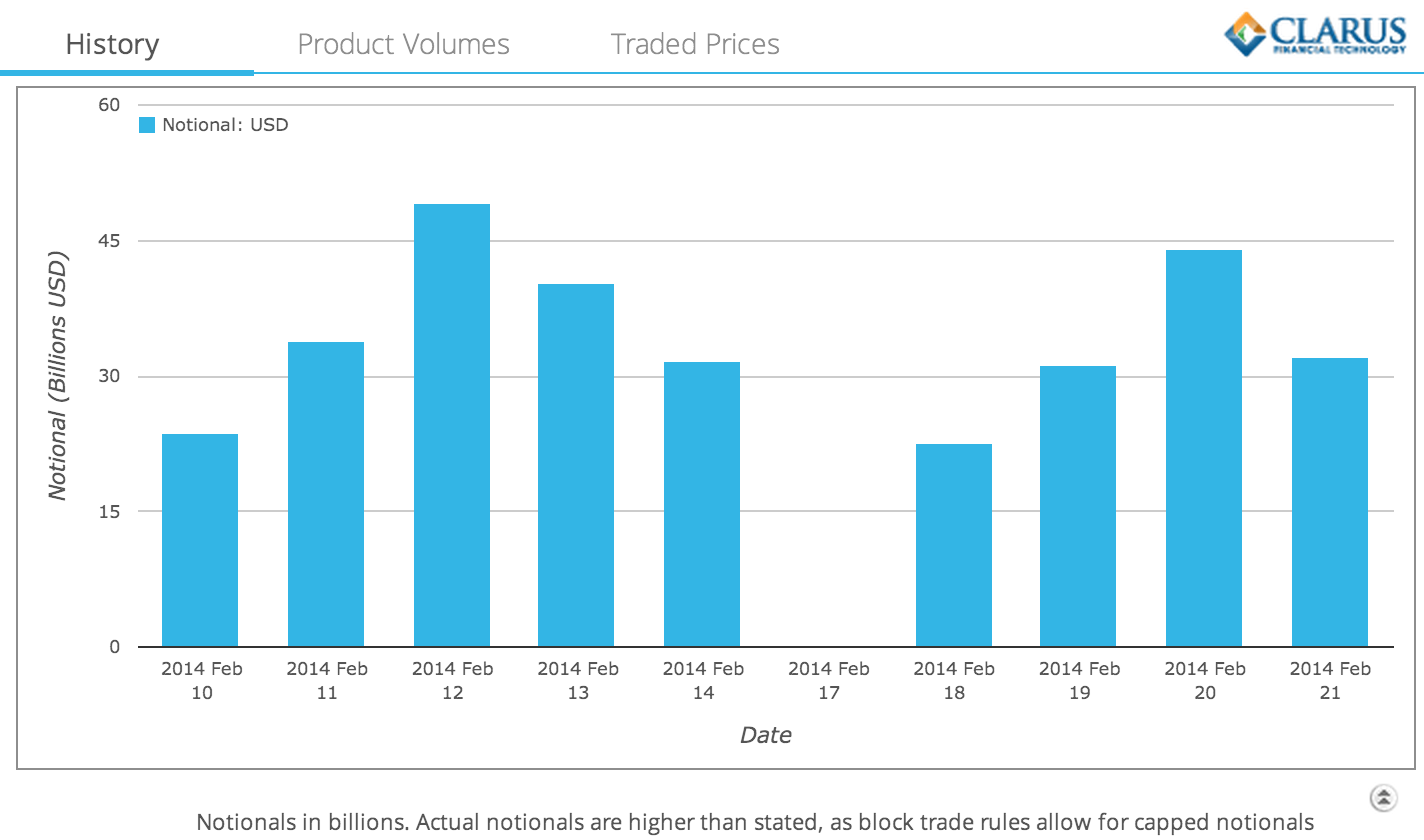
A very similar profile, just less volume; very roughly around 50%.
Week One Detail
Lets now switch to looking at just the spot starting cleared swaps traded in the four days from Feb 18 to Feb 21.
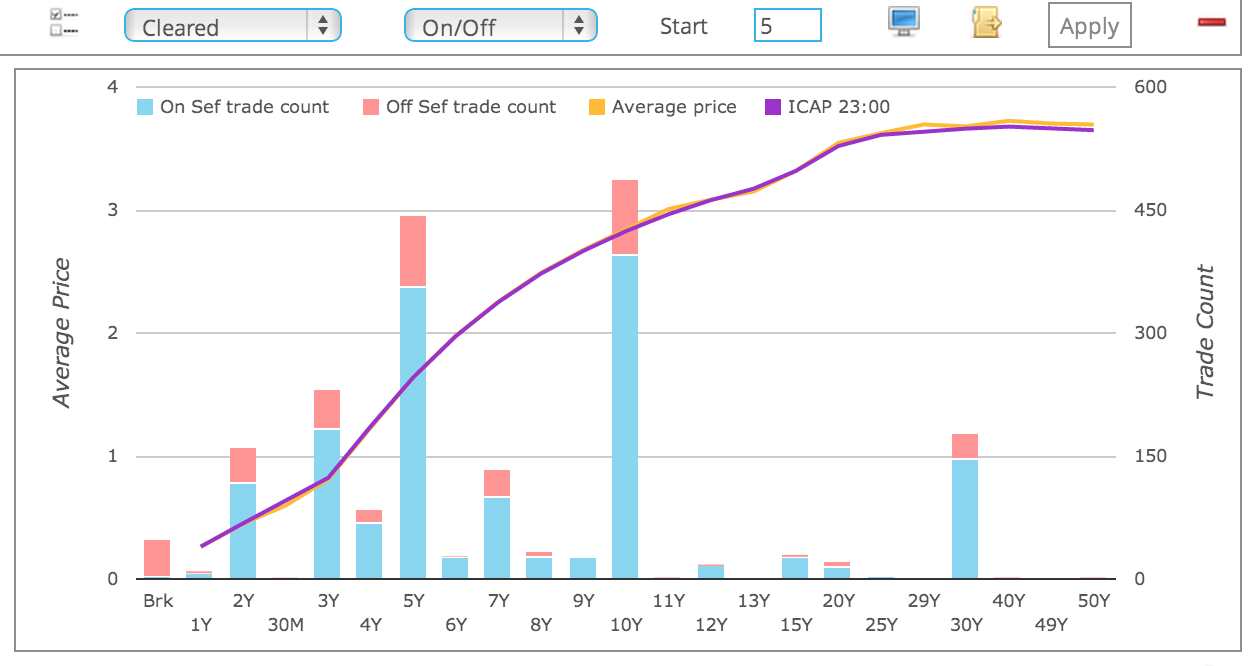
Very interesting, but given the amount of data, we need to look at the figures.
First Looking only at those tenors that are currently MAT.
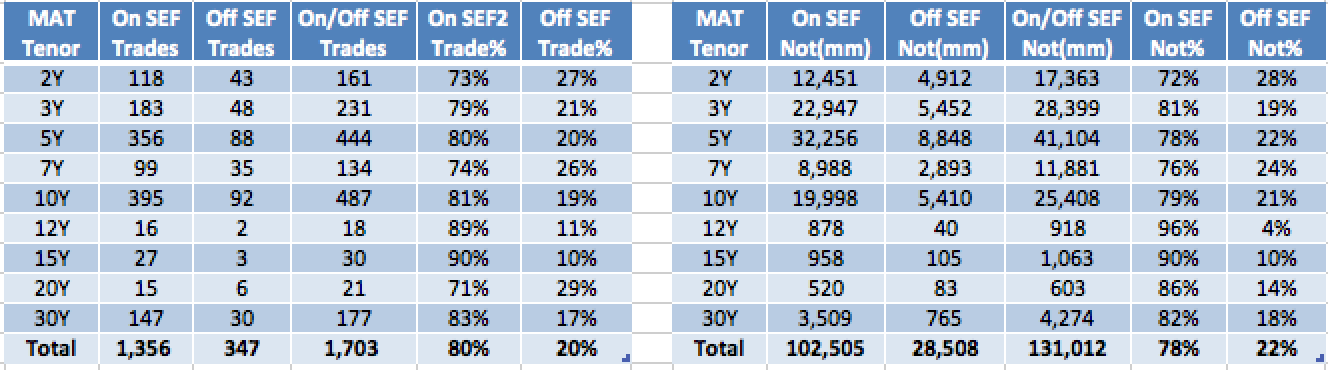 (Corrected mistake in original table for 5Y notional and total – see comment).
We can see that:
- 1,356 trades out of 1,703 trades for MAT Tenors are On SEF, or 80%.
- 347 trades out of 1,703 trades for MAT Tenors are Off SEF or 20%.
- In gross notional terms this is 93% On SEF vs 7% Off SEF.
- Or $393billion On SEF vs $28.5 billion Off SEF.
- So the exemption for Packages (and Non-Par Swaps not MAT) is 20% in trade terms or 7% in notional terms.
- Which is low enough to be reasonable.
Lets now look at the same table but for Non-MAT Tenors.
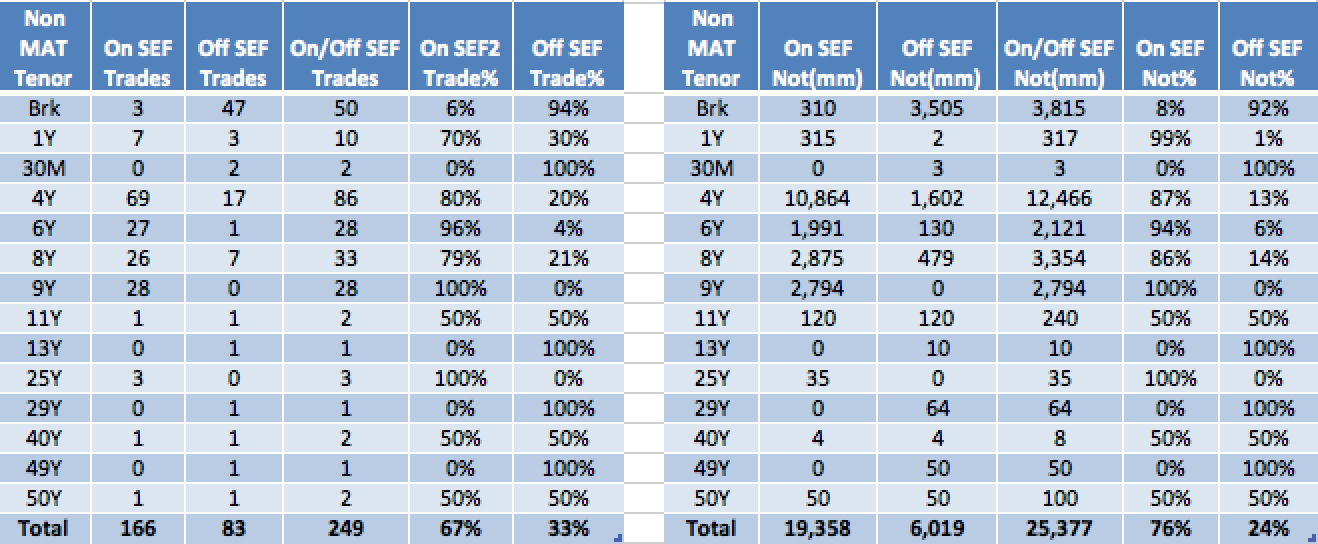
Which shows that:
- 166 trades out of 249 trades for Non-MAT Tenors are On SEF, or 67%.
- 83 trades out of 249 trades for Non-MAT Tenors are Off SEF or 33%.
- In gross notional terms this is 76% On SEF vs 24% Off SEF.
- Or $19billion On SEF vs $6 billion Off SEF.
- 4Y Tenor is currently 80% On SEF.
- So while it will only be MAT after Feb 27 (Tradeweb submission), it is already trading like it is.
- 6Y will also be MAT after Feb 27 and is trading 96% on SEF.
- 8Y & 9Y will not be MAT after Feb 27.
- However the volumes are very similar to 6Y, suggesting that they should also be considered for MAT in the future.
- All other Tenors and their a quite a few, have a very small number of trades
- Except for Broken (irregular) dates
- There are 47 such trades, with $3.5 billion notional
- So a small number and probably not worth the complexity of capturing onto SEF platforms
Forwards Swaps and IMM Swaps
Currently we do not isolate these out in SDRView, except by inference from totals.
However as there is significant volume in these and the first two IMMs are now MAT, we plan to do this in the near future.
Summary
After a low volume day on Feb 18, daily volumes in the first post-MAT week, were similar to the prior week.
That low volume day was 35% lower than Feb 14 and not 80% as originally reported by ISDA.
For week one, 80% by trade and 93% by notional of MAT Tenors have traded On SEF.
For week one, 67% by trade and 76% by notional of Non-MAT tenors have traded Off SEF.
4Y & 6Y Tenors will become MAT after Feb 27.
8Y & 9Y should also be considered as very similar in volume to 6Y.
Broken date spot starting swaps are traded Off SEF.
What will happen in week 2?
Well you can find out for yourself using SDRView.
Or wait for my next blog (no promises, only if newsworthy).
Thank you for reading this far.
Thanks again for alerting us at Risk to the problems with the Isda data – we spoke to two other sources after the story went up who also thought the figures were wrong, and we were making further enquiries when Isda changed the numbers.
We couldn’t alter our article until we had some kind of explanation from Isda, but have now amended the original story: http://www.risk.net/risk-magazine/news/2329889/cleared-us-dollar-swap-volumes-drop-80-on-first-day-of-sef-regime
Hi Amir,
Have been reading your blog with interest, many thanks for posting.
We performed a very similar analysis and, in general our figures (for gross notional & number of trades) broadly correspond to yours. However, our figure for 5Y USD Fixed Float On SEF gross notional was nowhere near what you have in the table above (in fact it was almost precisely one tenth).
In terms of numbers of trades the table above suggests that 20% of these trades are off facility but less than 3% of the notional value was traded off facility ($8,848MM Off vs $322,560 On), implying that On SEF trades have an average notional value that is almost 10 times higher.
Struggling to get my head round the disparity. Could there be an erroneous zero at the end of that number of $322,560 or might this be down to a difference in methodology (I have detailed ours below for reference)?
Methodology
We took data from DTCC’s real time dissemination dashboard & applied the following criteria:
Trading days: 18th – 21st Feb
IRS fixed floating, USD LIBOR
New trades only, cleared trades only
Day count: 30/360 & Actual/360
Excluded swaps starting >T+2 after execution date
For block trades, took capped amount (i.e. total notional will be understated)
Thank you for spotting this.
Their was a trailing zero caused by my dividing the 5Y notional not by 1 million (as intended) but 100,000.