We’re now through the 2nd roll-off of packaged trade no-action relief. As of June 2, packages containing at least one MAT product (and other swaps) are required to trade On-SEF. This has resulted in quite an active week in SEF data. Lets get to the numbers.
First up, overall activity, trailing 5 weeks:
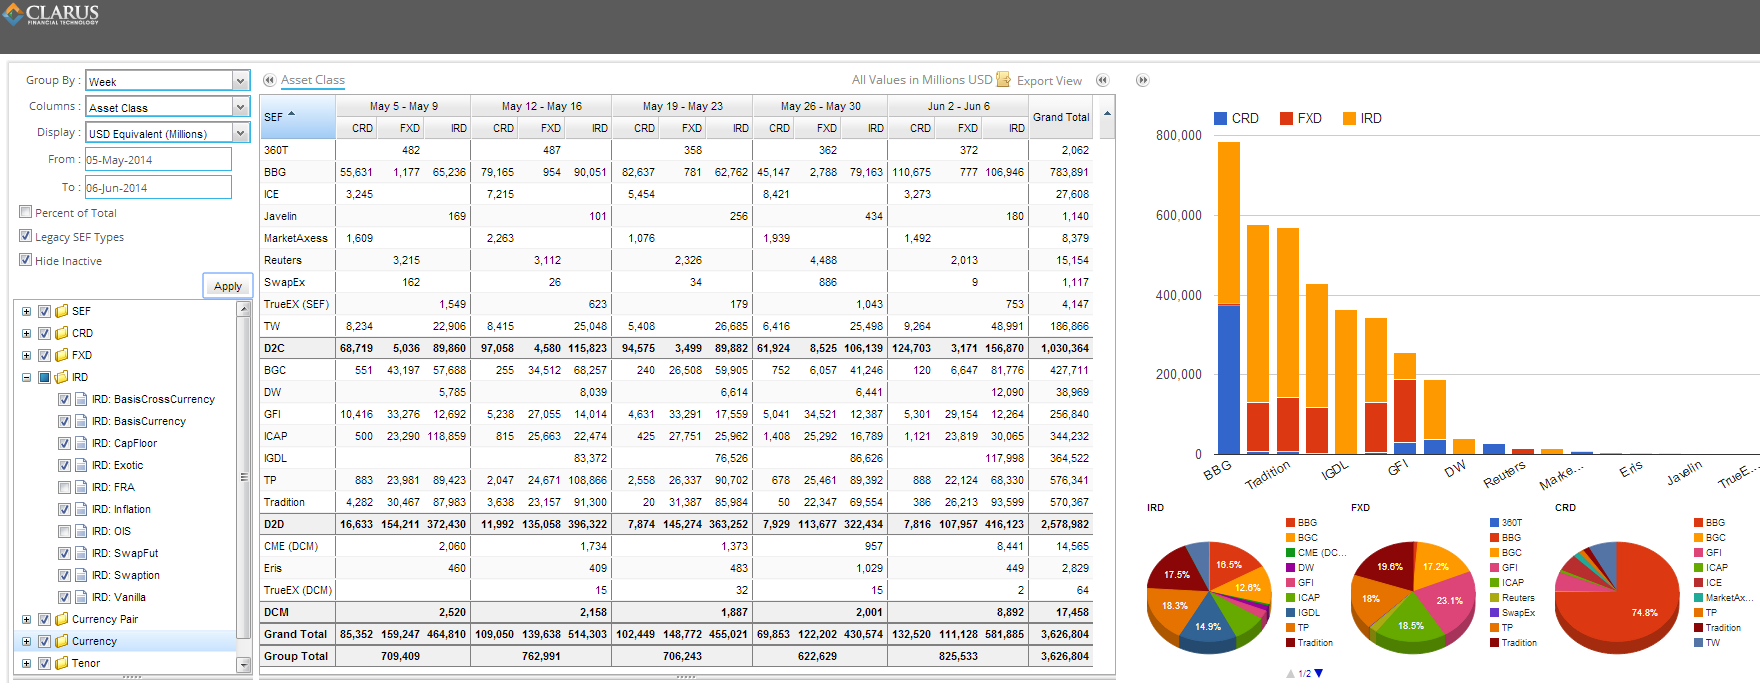
Interesting to note:
- Bloomberg is now the 2nd largest IRD player, and continues to dominate Credit
- The shift of ICAP’s IDB IRD liquidity seems to have seamlessly made its way from ICAP SEF to IGDL
- Tradeweb’s IRD activity has seen a decent pickup
- Something is going on with CME DSF (nice trend up)
So lets look at these in percentage terms:
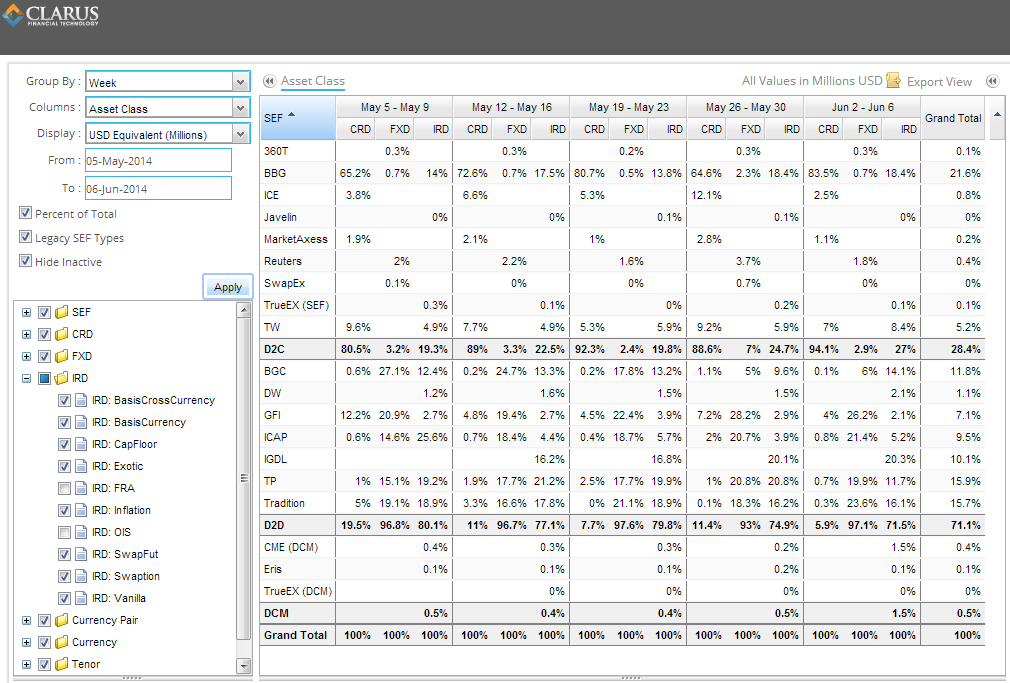
What jumps out here is:
- Bloomberg has accounted for 21.6% of the SEF marketplace, spanning both D2D and D2C.
- D2C is now 27% of the total rates market. A result of the packages? I believe so.
What happens if we look at the rates market, but add the FRA and OIS activity, but we duration-adjust the numbers? Lets see below:
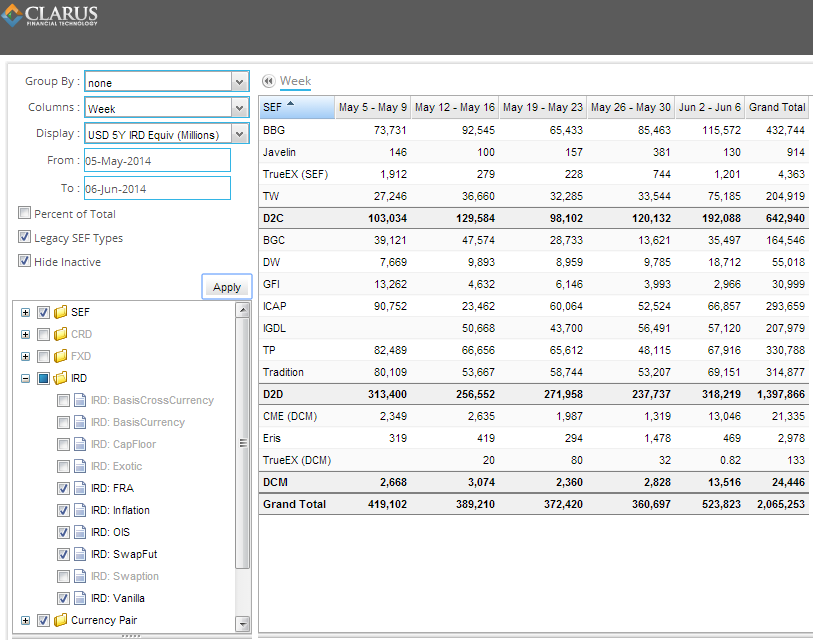
Fairly surprising, as this now tells us that when looking at the most recent week:
- 192bn of risk was put through the client SEFs. This accounts for 36.7% of total IRD activity (instead of the 21.6% we see using pure notional)
- Tradeweb is doing roughly as much as any one IDB (75bn this most recent week).
- CME’s DSF contacts can also be seen here in perspective. Do they really account for about 1/10th of Bloombergs IRD activity last week (13bn vs 115bn)? I believe there are some contract rolls happening, but still quite large.
That’s all for this week. Trends seem to be developing, but perhaps too early to tell.