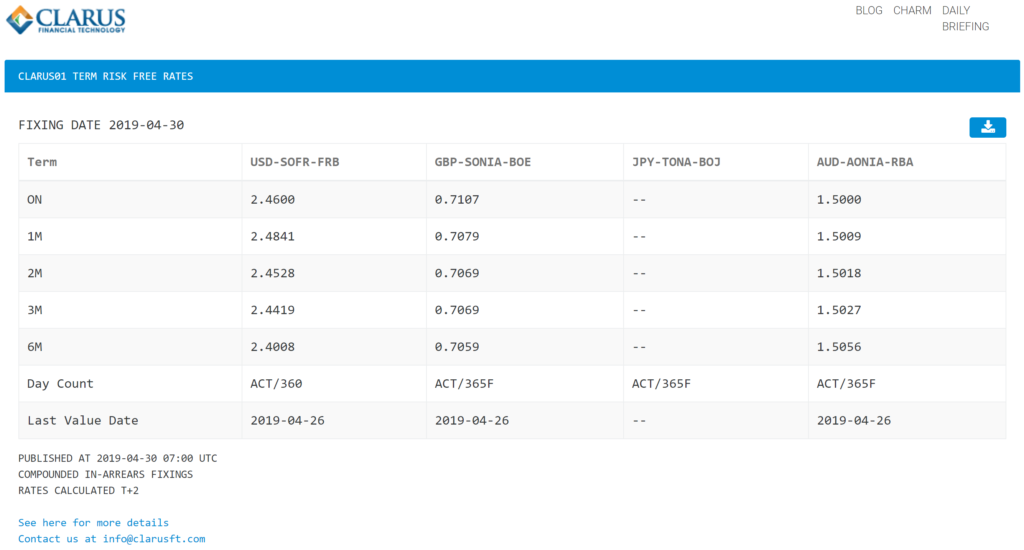
The Clarus website has a very interesting free service under the LOGIN tab called ‘Term RFRs’. This shows the compounded RFRs for the fixing date (yesterday) looking back overnight, 1, 2, 3 and 6 months for SOFR (USD), SONIA (GBP), TONA (JPY) and AONIA (AUD).
This blog will look at the compounded SOFR rates for 1 and 3 month since June 2018 which is a few weeks after SOFR was first published.
This is compared with a ‘smoothed’ version of the compounded SOFR to show the differences.
The Basics of SOFR Publication
The Federal Reserve Bank of New York publishes SOFR each day; the rates and description of SOFR can be found here. The daily rate is published the following day and these daily rates are used to calculate the compounded rate over a specific tenor such as 1 month as found on the Clarus Term RFRs page.
The Clarus Term RFR page shows the compounded SOFR rates over the terms on each row.
For example in the 1 month, the daily SOFR is compounded over the previous month and the simple interest rate is calculated from the discount factor: this is the published rate. On 22nd April 2019 the 1 month was 2.4792 which is the simple interest rate from 22nd March to 22nd April 2019 calculated by compounding the daily FED SOFR on each business day in the period. This is a snapshot of the Clarus page for the SOFR column.
CLARUS01
Clarus SOFR Term RFRs:
Term SOFR since May 2018
The following graph shows the SOFR (overnight), 1 month and 3 month rates calculated each business day since May 2018.
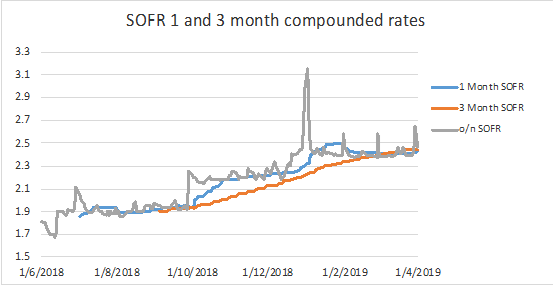
The 1 month term rates start in July 2018 (i.e. looking back 1 month) while the 3 month term rates start in September 2018.
One of the most notable features of the overnight SOFR line is the periodic spikes in the rate over some month, quarter or year ends. This is quite typical of the USD repo markets (on which SOFR is based) which can experience short periods of tighter cash conditions leading to the rate spikes.
This feeds into the SOFR calculation which can be seen in the term rates especially in the 1 month rate. The impact on the 3 month rate is less than the 1 month as the spike is spread over a longer term and therefore the effect is averaged out against the other rates.
What If There Were No Spikes?
Recently there have been some suggestions that fewer and/or lower spikes in the SOFR might be beneficial to the adoption of SOFR by markets.
We used the same data as in the calculations above but ‘smoothed’ the data across the end of months where the SOFR often rose. We replaced the spike data points with the SOFR from the average of the last 5 days of ‘normal’ conditions.
For example, over the 2018 year end, SOFR average for the 5 days before 31st December 2018 was 2.43 but spiked to 3.00, 3.15 and 2.70 for the following 3 rate sets. We replaced these 3 rate sets with the average of 2.43.
This was also done for each month end.
The following charts show the actual SOFR, the smoothed SOFR and the recalculated 1 and 3 month term rates.
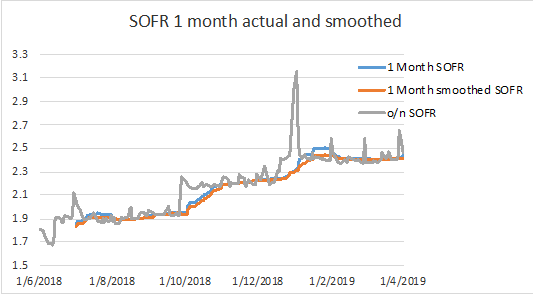
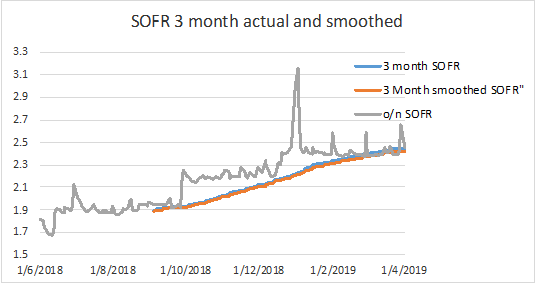
The 1 month SOFR/smoothed SOFR does show some difference in rate especially over year end. But the 3 month rates are almost identical.
The following chart shows the basis point impact of the smoothing for the 1 and 3 month term rates, i.e. actual term SOFR minus the smoothed term RFR.
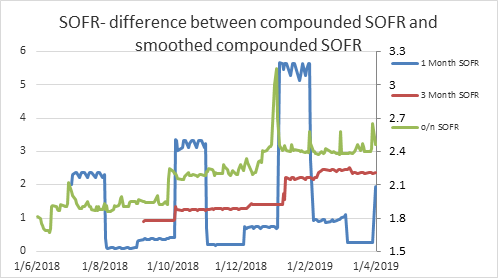
The smoothed term SOFR rates are less volatile than the real-world rates but the impact is only single figures in basis points. Specifically, the 1 month difference is up to 5 – 6 basis points and the 3 month difference is only a maximum of 2 – 3 basis points.
Is This a Feature or an Artefact?
This question is part of the current debate about the adoption of SOFR: should the FED actively add liquidity at critical times to reduce the number and size of the SOFR spikes to create more confidence in SOFR?
This is an outstanding question but for compounded SOFR (as used in derivatives and cash instruments) the impact would likely be less than 5 basis points for the much-used 1 and 3 month terms.
It is also worth noting that Libor has similar features over the ‘turns’ so markets have been accustomed to this effect for many years.
Summary
Much has been recently written about the impact of SOFR rate spikes at certain times. It has an impact on the term SOFR calculations (1 and 3 month) but this has been limited to a maximum of 5 -6 basis points and typically less than 3 basis points.
This can be seen as a feature of the SOFR benchmark and has some parallels in Libor. For some users a difference of 5 basis points in the 1 month is quite within expectation (when compared with Libor) while for others this may be a feature they would prefer did not exist.
We will have to wait for further developments in SOFR.