Did SEFs Survive the Crash?
Yesterday’s events reminded everyone, everywhere of what trading in ‘08 and ‘09 was like. And yet Swaps trading has changed completely since then. In theory, we should now see continuous trading across SEFs with a degree of liquidity constantly available.
The market conditions yesterday were the first real test of electronic Swap trading since they were Made Available to Trade. In the equity markets, CNBC report that liquidity was bizarrely absent at the opening of the S&P, such that relatively normal sized trades had outsized effects on prices. Meanwhile, Fixed Income markets experienced a “melt-up” in price in reaction to weaker-than-expected Retail Sales numbers. What did we see during the day in Swaps space?
Volumes
It was a record day for volumes in USD swaps on-SEF (as well as CME Eurodollars), as shown on SDR Researcher:
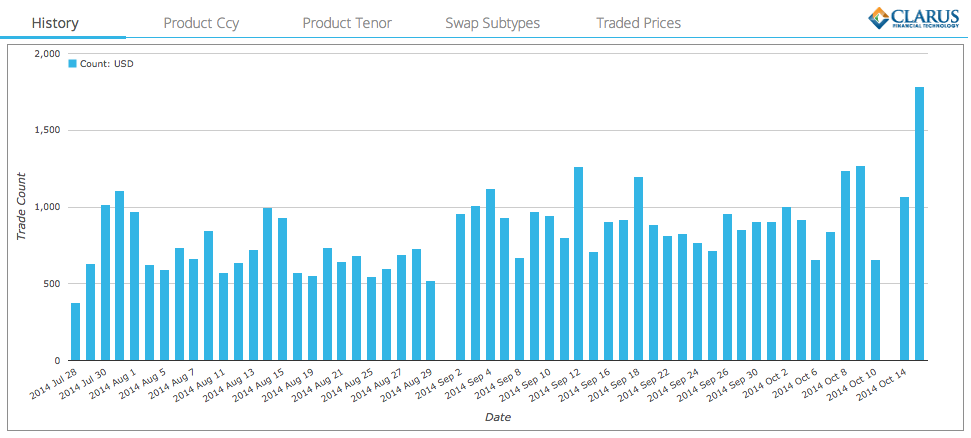
Evidently, volumes were far from drying-up! The above chart is based on trade-counts, therefore was all the volume “only” short-end action – implying that the amount of risk being traded plummeted? If we look at the three sessions between 10th-15th October, we can see this is resolutely not the case:
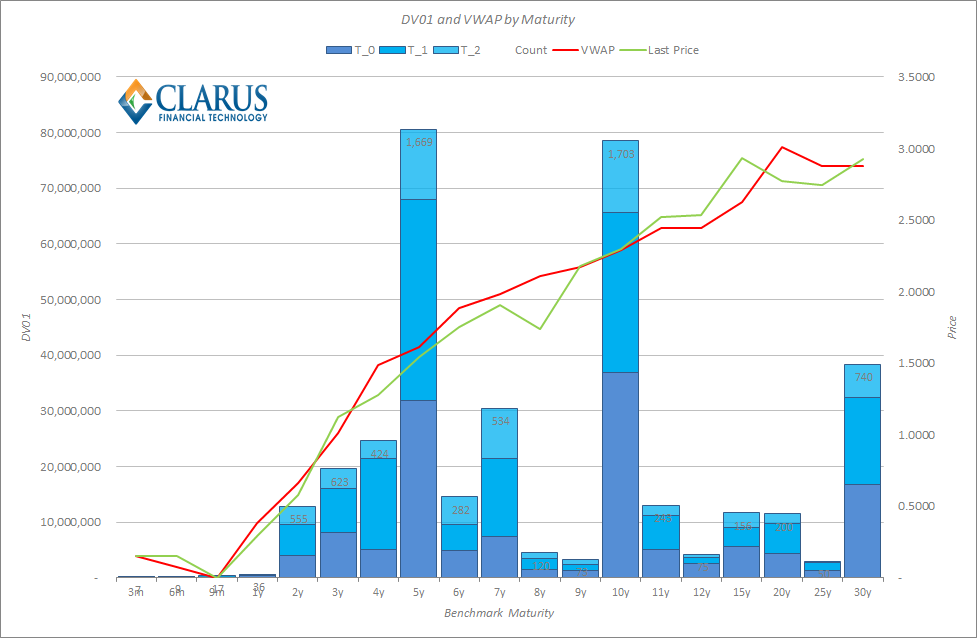
The darkest blue bars on the above are for October 15th. On the face of it, the volume and VWAP data represent a relatively normal day, with volumes concentrated in the 5y, 10y and 30y tenors – as we have seen repeatedly in the past. Of particular note is that the VWAP for the 3 sessions is almost identical to the closing price of 10y swaps on the 15th October – therefore it does not appear that any huge trades were printed at the unusual intraday prices we saw throughout the day.
Prices
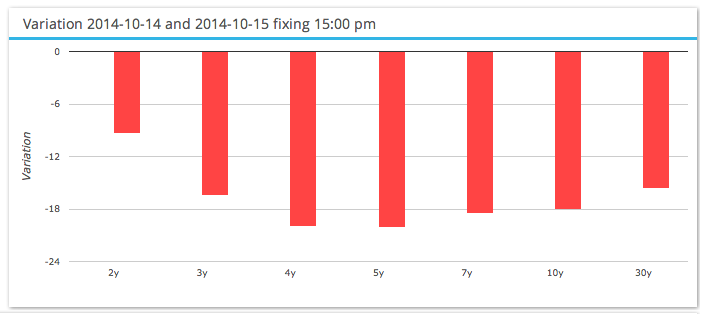
SDRFix highlights just how severe the price moves were yesterday – for example 5 years was over 18bp lower over a 24 hour period:
The low yields of the day were hit around 09:30 ET (15:30 CET on my price chart below). 5 year swaps traded thus:
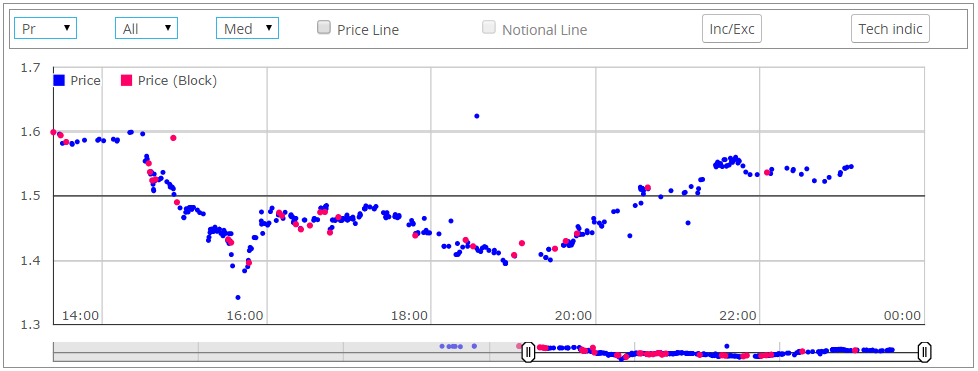
The low print was 1.34218 at 09:38 ET- a jump lower of nearly 5bp from the previous print of 1.3912 at 09:34. We then had to wait another 5 minutes for a subsequent trade – at which point yields had popped back up to trade at 1.3855 at 09:43.
Liquidity
What does this tell us about liquidity during this time? If you look at the average size traded in 5 year swaps, it is roughly $35k over the whole of October 15th. In the period from 09:33 to prices stabilising around 09:55, the average size was over $40k – so there is nothing unusual going on with sizes. However, if you look at the evolution of how much traded, there is a clear gap in liquidity provision around 09:33:
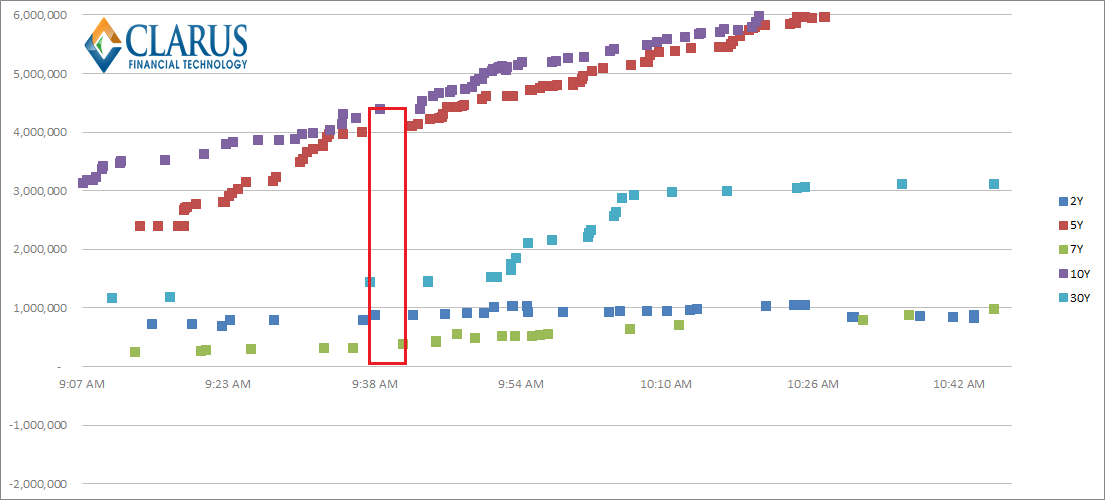
Each block on the above charts represents a new trade. There is clearly an absence of trading taking place in 5 year swaps – which is normally the most liquid point along with 10 years. Starting from 09:34 to 09:42 we see no trades in 5 year swaps. If this didn’t also coincide with the huge volatility in prices, then it would typically just be seen as a lull in trading. However, the fact that trading was so active in the minutes afterwards does suggest some kind of liquidity exited the market completely.
I’d love to hear from any of the SEFs regarding this time period. Did they witness a sharp widening in bid/offers across their order books? Was liquidity support really absent for a 5 minute period as prices went crazy? Why did liquidity suddenly come back to the market?
For SEF operators themselves, it is an important point. Market participants need to have confidence that SEFs truly offer continuous trading, even during periods of extreme market stress and volatility. The data from yesterday suggests we are not there yet.