Every quarter, monthly SEF volumes are distorted artificially higher by IMM roll activity. What is it and how can we identify the trades?
The History of the IMM Roll
The International Monetary Market (IMM) was a division of the CME back in the 1970s. There is a great essay here for the history buffs. In short, it was the first futures exchange to successfully break into financial contracts, first with currency futures and later spawning interest rate futures through a battle of innovation with the CBOT. This led to their first cash-settled offering, the Eurodollar contract, that settles against a 90-day time deposit – referencing the 3 month Libor fixing.
To try to avoid as many regular holidays and non-working days as possible – and presumably to provide consecutive roll dates – these Eurodollar contracts were designed from the outset to mature on the third Wednesday in the delivery months of March, June, September and December.
Nowadays, these 3 month Eurodollar contracts are used as the shortest maturity instruments on an Interest Rate Swap curve that references 3m Libor. Every 3 months, one of these futures contracts expires, and the instruments used to build the curve are “rolled” by three months (to include a new, longer contract). These expiration dates are quite a “thing” in swaps trading – so much so that the dates themselves are part of the vernacular and commonly referred to as IMM dates (or “Immy”).
All sounds simple so far
In theory, the expiration dates of these futures should be a “calibration-neutral” event. Unfortunately, this is normally not the case. In reality, swaps traders experience a number of PnL and risk events when the curve structure changes:
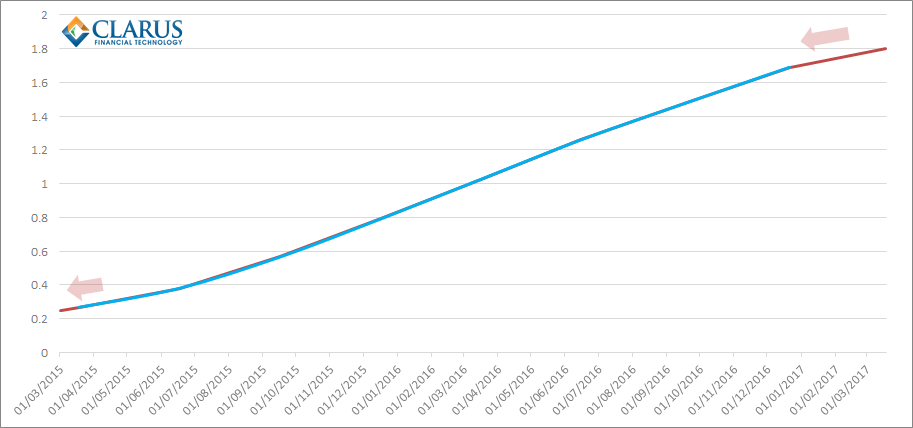
- Change from implied prices to settlement prices. For the change to be “PnL-neutral”, the implied price on T-1 of the new futures contract must be the same as the actual settlement price of the new futures contract on T-1 (plus/minus a convexity adjustment). Think of it as the price of the contract where the top arrow on the chart above is shown. If our curve were a perfectly calibrated curve, this would not be a problem. In reality this is far from the truth. The combination of inflexion points, forward curve smoothing and the switch from linear interpolation to second-order derivative interpolation methodologies means that the point of the curve subject to the most manipulation tends to be the one between futures and swap instruments.
- Decay of DV01 risk from Swaps to Futures. At the longest end of the futures strip, swaps traders will see a change in their risk allocation between futures instruments and swaps. This is because the new futures contract is 3 months longer than the expiring one, and so will be closer in maturity to the shortest interest rate swap on the curve. Coupled with the effect in (1), it makes it very hard to estimate your PnL when you have a “gamma” effect from a change in instruments used to construct your curve!
- Decay of DV01 risk from Futures to Cash/and or FRAs. At the shortest-end of the futures strip, the risk allocation between futures instruments and (traditionally) cash instruments (or now OIS-calibrated equivalents) will change. In effect, the cash-settlement of the first future removes all risk of this contract, and traders are left with the risk from the underlying swaps that were hedged by this expiring contract.
- Change of implied prices at the very short-end. Depending on curve-build methodology and specifically, which instruments take precedence over others, traders may find a change in their implied short-end FRA prices at the front of the curve. This tends to be less of a problem because interpolation methodologies are typically shared between cash/cash equivalent products and futures.
Often, traders will manage the four factors above over a number of trading sessions ahead of the IMM roll. It is also increasingly rare to wait for the actual expiration of the future before rolling the curve. This aids in smoothing the PnL of the inevitable convergence trades between cash fixings and the expiring futures contract, and can help risk manage the four factors above.
Of most importance during this process is managing the effect of (3). This is the so-called “Stub” position that a trader is running – a position that is almost unhedgeable and certainly very difficult to manage. This is because all liquidity is concentrated in the first futures contract – such that hedging any risk that settles before the expiry of this front contract is virtually impossible. Risk mitigation efforts such as ICAP’s Reset and tpMatch from Tullett’s aim to help traders hedge this risk during weekly volume matching sessions in the FRA markets. Managing this risk is really the subject of a lengthy blog on its own!
The IMM Roll in the Data
We have previously looked at estimating the IMM roll volumes in December – through making a simple assumption that the front month risk is rolled into subsequent contracts during the expiration month.
We can repeat this analysis for March. From SDRView Pro, we look at all swaps traded out of an IMM date for the first 18 days in March (i.e.until expiry of the March contract):
 Showing:
- There was $15.999bn traded in 5y USD Swaps starting on the Mar IMM vs $13.25bn on the Jun IMM.
- We therefore assume that of these trades, $13.25bn (the smallest number) was related to IMM rolls.
- To correct for roll activity, we then have to double this number – from $13.25bn to $26.5bn to reduce both Mar and Jun volumes accordingly.
- Overall, we can therefore allocate $101.1bn of volumes to rolling Mar IMM positions into Jun.
- Or in DV01 terms, $73.5m of risk.
How accurate is this assumption? I believe there are two major drawbacks to this estimation:
- It assumes all March positions are rolled into June. This is likely to be inaccurate, because some March positions will be unwound on a standalone basis or traded in and out of before the March expiry.
- Similarly, this assumes most trading in Sep is related to the roll of positions from March, instead of the initiation of new positions or the unwinding of existing positions.
To get a more accurate estimate, I therefore went to the trade-by-trade history.
The beauty of time-stamps
Because we have now industrialised our Spread and Butterfly identification process, we can extend the same logic to look for “risk-neutral” trade packages on a trade-by-trade basis throughout any trading day. I therefore extended a similar logic to identify IMM roll trades based on time-stamp and matching benchmark maturities. This allows me to not only identify Mar to Jun rolls, but also Mar to Sep. For this first run, I just focused on the first two IMM expiries to try and make a fair comparison with our estimate above.
IMM Rolls
Looking at the data on a day-by-day basis, we see that activity is concentrated in 3 sessions:
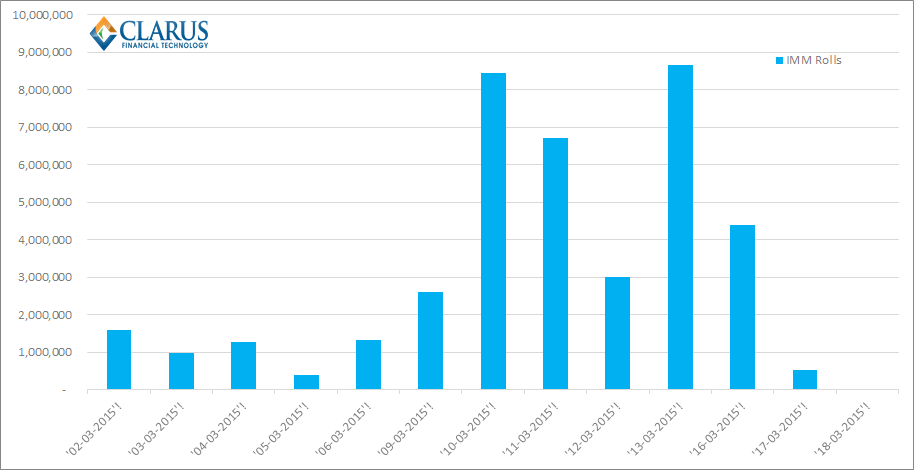
The chart shows:
- The Friday before expiry is the most active roll date, accounting for over 21% of all IMM risk that was rolled.
- The total identified on a trade-by-trade basis is much lower than our previous estimate. We see a total $39.9m in DV01, just 39% of the previous number.
- The busiest four sessions account for over 71% of all roll activity.
Overall, we can see that roll activity is super-concentrated in the 3 or 4 sessions leading to expiry on the 16th. Whether this is due to a lack of liquidity prior to this or a simple leave-it-to the-last-minute strategy is hard to tell. Given the lack of trading before these sessions it doesn’t seem to give counterparties long to manage the roll or identify key levels at which to trade – possibly reflecting the lack of volatility and the operational aspect of this portfolio maintenance. Sounds like this is begging to be automated to me!
In Perspective
Finally, we should look at the above IMM roll volumes relative to the totals per day. See chart below:
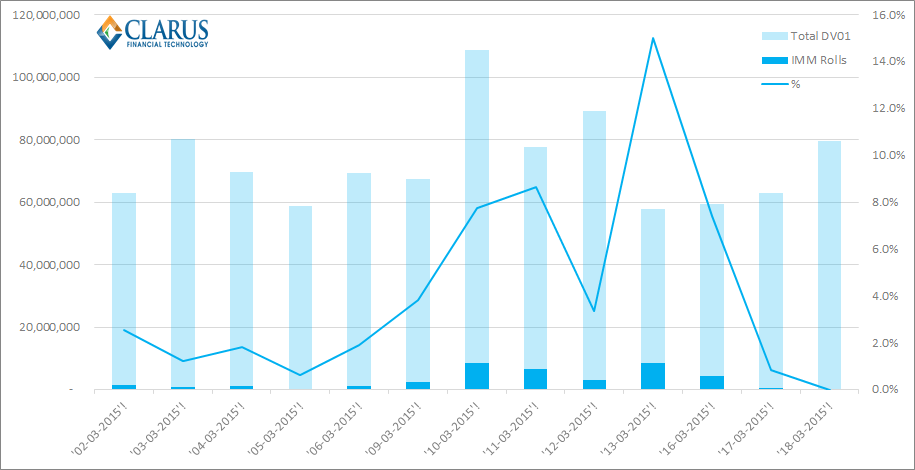
As we can see, the roll volumes reach 15% on the day before expiry. This is clearly a low volume day in every other respect – maybe because everyone is still trying to get to grips with the four factors we listed above!
However, what this does mean is that the IMM rolls have a significant impact on volumes on what would otherwise be low volume days. It is therefore a worthwhile process to strip out these volumes on a trade-by-trade basis to have a more accurate reflection of liquidity and real trading volumes.
Our trade-by-trade process is fairly strict because it demands an identical time-stamp for the two legs of a trade. Whilst this is a fair assumption for any trades done as a package, it will naturally miss any processes that try to avoid paying a “bid-offer” spread and manually execute on the bid/offer side of each contract. With CLOBs yet to take-off in SEF land, this is unlikely to be a significant portion of volume as yet, but it is worth noting this may become de rigueur in a CLOB world.
This trade-by-trade analysis yields $19.95m of DV01 in activity for the March contract (i.e. $39.9m divided by 2). Overall, the March contract saw nearly $50m in risk trading. Is it fair to say then that only 40% of March risk is related to the IMM roll? This is what the data tells us. However, I think it is hard to give an unequivocal answer until we repeat the analysis for a number of different IMM roll dates. Watch this space.