Exploring Seasonality in a Time Series with R’s ggplot2
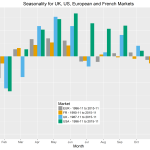
Inflation index values are decomposed into trend, seasonality and noise. Certain types of graph help identify seasonality. Graphs can be created simply and quickly in R. Simple graphs can be refined for stronger visual impact. Recently, I have been looking at inflation indices and studying their seasonality. The best way to see the overall trend and seasonality in this […]
Exploring Commodity Data on the SDRs
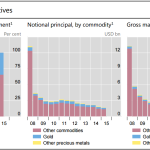
Today we go to the far reaches of the Swap Data Repositories and explore commodities. You probably know that SDRView normalizes and enriches the Interest Rate, Credit, and Foreign Exchange asset classes. We’re quite fluent in that. Further, we have done some studies on the Equity asset class in the recent past. That leaves us […]