Today we go to the far reaches of the Swap Data Repositories and explore commodities. You probably know that SDRView normalizes and enriches the Interest Rate, Credit, and Foreign Exchange asset classes. We’re quite fluent in that. Further, we have done some studies on the Equity asset class in the recent past.
That leaves us with only the Commodity asset class to investigate. We’re frequently asked about this more esoteric realm of SDRs, and it’s become time to open the lid. After all, esoteric is what mining SDR data is all about.
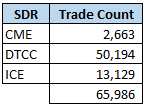
So I began by pulling a month’s worth of commodity data from DTCC, ICE, and CME. Right off the bat, I stripped out all of the trade information to do with netting, terminations, unwinds, etc. I did (and we do) however process all of the cancel/replace messages, such that my data set should reflect all “New Trade” activity over the course of the month. For June 2016, this is 65,986 trades.
SOME ANALYSIS
From a trade count perspective, DTCC seems to have the lions share:
Next step is to try and make sense of the data. So, we need to (attempt to) normalize it.
This is where it’s a bit frustrating. Forgetting SDRs for the minute, commodities have always been the bane of financial software. Within most asset classes, there are fairly finite sets of products. FX Options for example, you have a finite list of currencies (with maybe a dozen liquid ones), and really only a handful of standard products. Yes, you can start getting into exotic options beyond your standard digitals and barriers, but the bulk of the information and data rests in maybe 95% of standard, easily describable trades.
With commodities, you might start with Energy as an asset class (or sub-asset class as it may be). Then you need to talk about Crude Oil, Gasoline, Diesel, Jet Fuel, Natural Gas, Electricity. But it’s never that easy: is Corn Ethanol “Energy” or is it “Agricultural” because its Corn based?
The commodity world loves basis trades, because the trick with commodities is that there is some benchmark (eg Nat Gas at Henry Hub) that the rest of the nation or world trades in relation to. Hence I can write an OTC contract for the price of natural gas in my backyard. When “My Backyard Nat Gas” is a traded as a commodity swap vs Henry Hub, just what do you expect an SDR to do with that?
The answer is, regurgitate whatever the reporting counterparty said, “Myback NG Basis”, for example.
But hey, let’s try for the 95% and see where we get.
So I normalized all the data across these 3 SDRs into:
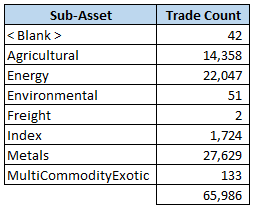
- Sub-Asset Class (Ags, Energy, Metals, etc)
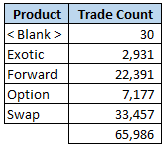
- Product (Swap, Forward, Option, Exotic). Note no basis swaps at the minute.
- Commodity (I’ll give a list further below. But think Corn, Gold, Silver, Wheat, etc)
Lets first look at the Product Types:
Next, what I’ve chosen to call “Sub-Asset” class:
And then by commodity. I ended up with 65 commodities in total after normalizing the data:
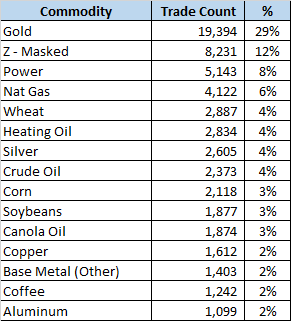
Interesting to see that “Masked” is the second most active commodity. So much for transparency!
Given that Gold accounts for nearly 30% of the reported trades, lets see what we’ve got. First by Product:
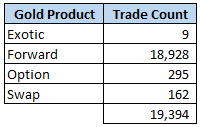
Then, within Forwards, which SDR is reporting these:
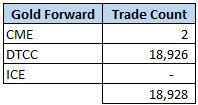
So, DTCC Gold Forwards seem to account for almost one-third of all SDR reported commodity trades!
Further, upon examination of these “Forwards”, it would seem that nearly every one of them is actually a spot transaction, if the dates on the SDR can be believed.
CORROBORATING THIS DATA
Always good to corroborate the data. The generally acceptable other source I turn to for derivatives data is BIS. If we look at their most recent report for commodity derivatives, we can glean some numbers, which is difficult to make heads or tails of.
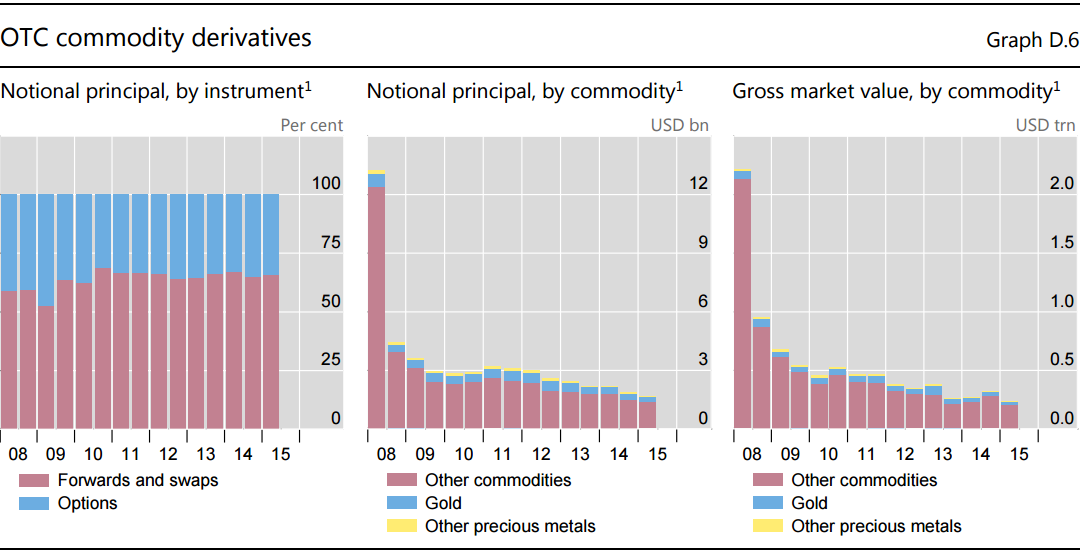
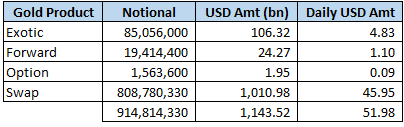
Is that less than a billion dollars of Gold derivatives? Per day?
Taking the US SDR data, we can perhaps glean that roughly $52bn of Gold derivatives are traded every day, with a concentration in the 162 swaps traded! Yes, I have confirmed the notionals are indeed quoted (at least reported) in ounces. Quite intriguing. So US SDR data says just over $1bn of gold forwards are traded each day, and $45b of gold swaps! It’s times like these that I am have either learned something new, or I am misled. Should we trust these numbers?
SUMMARY
I’m going to have to leave it there for today. I feel like I have opened Pandora’s box. If there are further reaches of the Commodity SDR universe you would like us to peer into, or would like to tap into this data yourselves, please get in touch or leave a comment below.
Thanks Tod, This was a useful insight into the makeup of commodities currently. As a rapidly growing trading market which is causing great difficulties data wise, do you see any push for standardisation in data formatting on these trade types?
Hi Ivy,
The CFTC do have an initiative to clean this up. I wrote about the initiative back in March of this year – here: CFTC ATTEMPT TO IMPROVE SDR DATA. It is quite a quagmire however, so its hard to see the data getting significantly better very soon. Also, a good article in Risk that corroborates my findings on commodity data in the SDR: Energy industry blasts ‘unusable’ CFTC commodity swap data.