A review of Credit Derivatives (CRD) and FX Derivatives (FXD) volumes and market share at Clearing Houses (CCPs) in 2024.
For CRD – index, single-name and swaptions:
- In USD, CDX volumes shaded up, with single-name CDS volumes flat.
- In EUR iTraxx, volumes were up, with ICE Clear Credit market share markedly up to 76.5% and LCH CDSClear flat at 23.5%.
- In EUR single-name CDS, volumes were down, with ICE Clear Credit market share markedly up to 63.9% and LCH CDSClear up slightly to 36.1%.
For FXD – NDF, options, forwards and spot:
- NDF volumes were up 22%, with INR, TWD, KRW, and BRL all over $2 trillion.
- Options volume up 72%, all at LCH ForexClear.
- Options outstanding notional increased to $426 billion.
All the charts and detail from CCPView.
Credit Derivatives Volume
First, we look at USD CDX, single-name CDS and Swaptions.
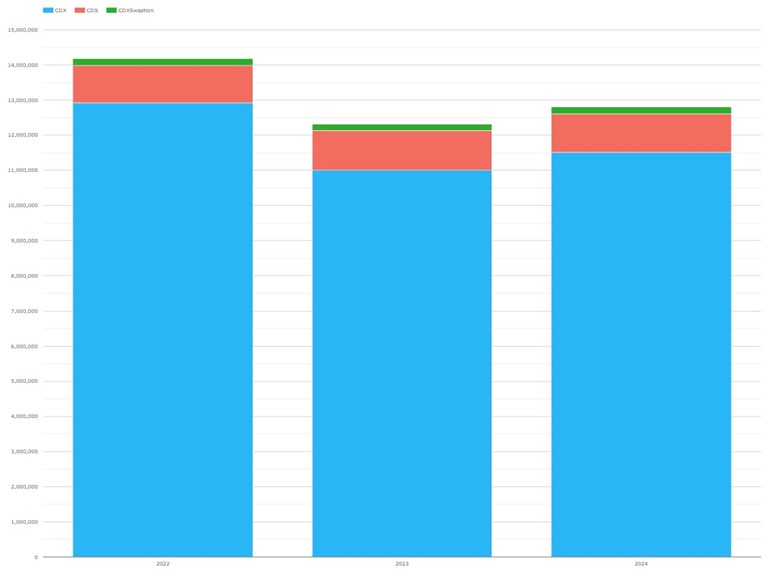
Chart 1 – USD CRD Volumes by product (USD millions)
- CDX 2024 volume of $11.1 trillion, up from 2023 volume of $10.6 trillion, an increase of 4.3%.
- Single-name CDS volume was $1.09 trillion, flat from 2023.
- CDXSwaptions volume was $189 billion, up from $174 billion, an increase of 8.9%.
- CDX volumes represented 89.9% of USD CRD volume with single-name CDS at 8.6% and CDXSwaptions at 1.5%.
Now we look at USD market share starting with CDX.
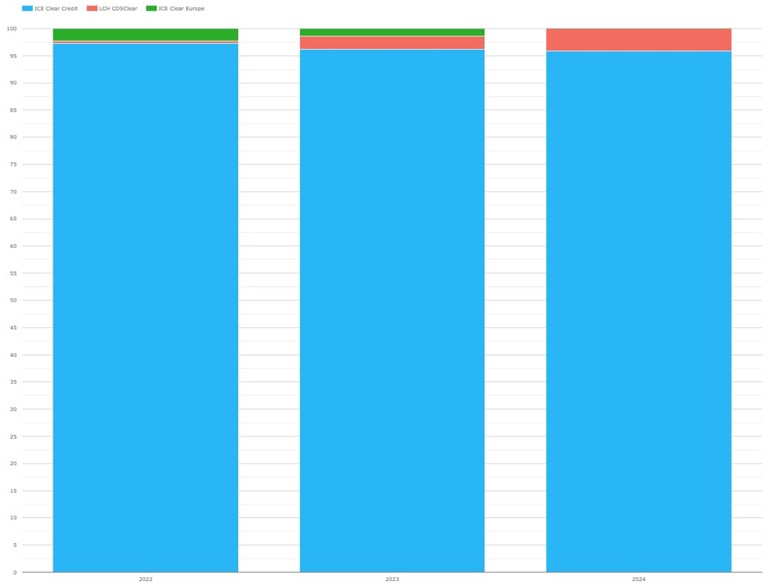
Chart 2 – USD CDX market share of CCPs
- ICE Clear Credit had 95.9% of USD CDX in 2024, down from 96.2% in 2023.
- LCH CDSClear had 4.1%, up from 2.3%.
Next, we look at the market share of USD single-name CDS.
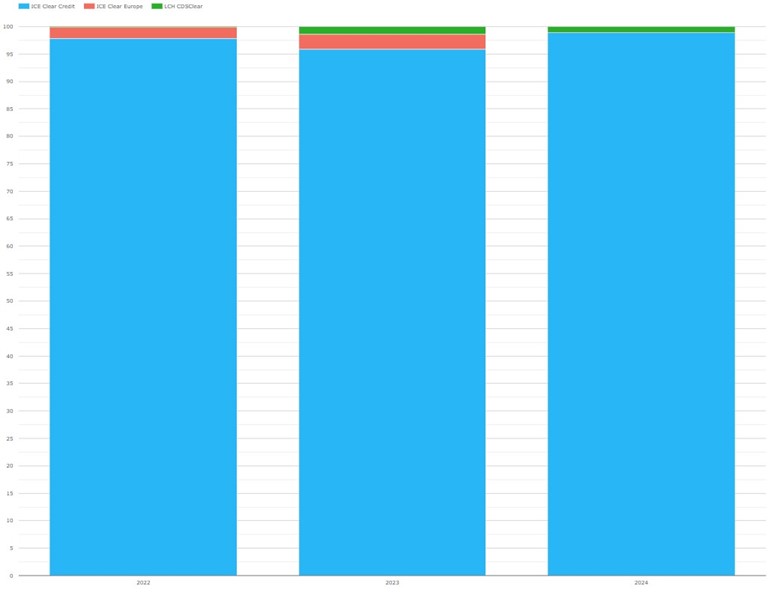
Chart 3 – USD single-name CDS market share of CCPs
- ICE Clear Credit had 98.9% of USD single-name CDS in 2024, up from 95.9% in 2023.
- LCH CDSClear had 1.1%, down from 1.4%.
Now, we look at for EUR CRD by product.
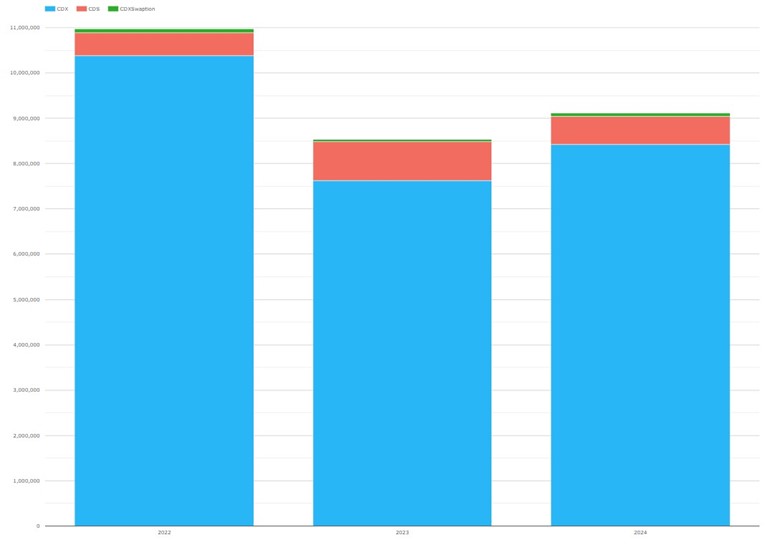
Chart 4 – EUR CRD Volumes by product type (EUR millions)
- iTraxx 2024 volume was €8.4 trillion, up from €7.6 trillion in 2023, a 10% increase.
- Single-name CDS were €617 billion, down from €856 billion, a 28% decrease.
- iTraxxSwaptions were €77 billion, up from €47 billion, a 62% increase.
- iTraxx was 92.4% of EUR volume with single-name at 6.8% and iTraxxSwaptions at 0.8%.
Now, we look at CCP market share starting with EUR iTraxx.
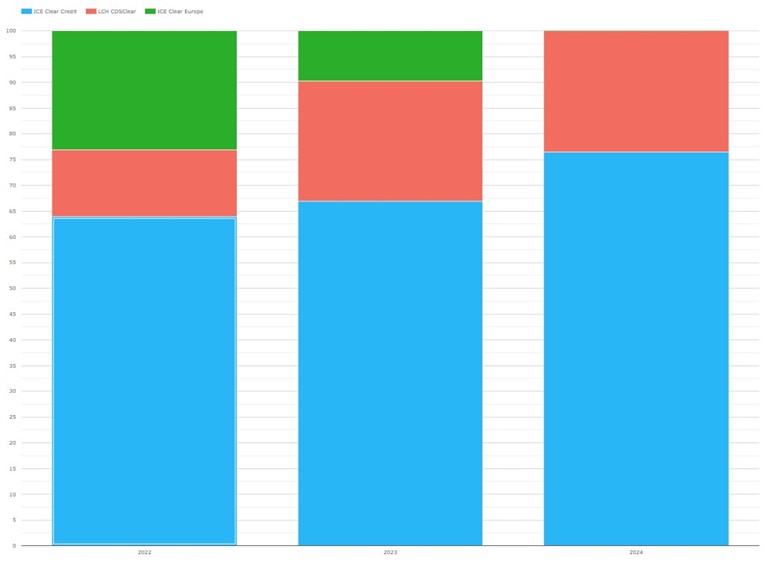
Chart 5 – EUR CRD Index market share of CCPs
- ICE Clear Credit had 76.5% share of EUR iTraxx in 2024, up from 69.9% and 63.9% in prior years.
- LCH CDSClear had 23.5%, up from 23.4% and 13%.
- ICE Clear Credit picked up most of the iTraxx share of the closing ICE Clear Europe.
Next, we come to CCP market share of EUR single-name CDS.
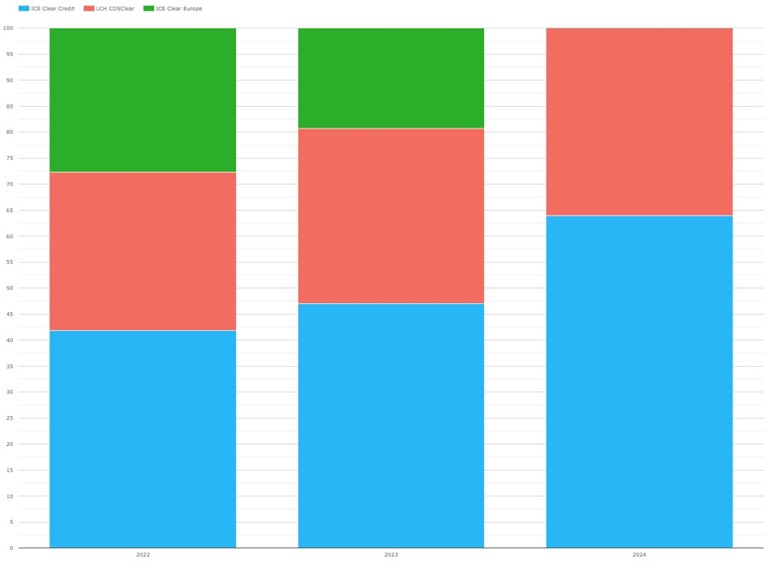
Chart 6 – EUR single-name CDS market share of CCPs
- ICE Clear Credit had 63.9% of EUR single-name CDS in 2024, up from 47% and 41.8% in prior years.
- LCH CDSClear had 36.1%, up from 33.8% and 30.5%.
- ICE Clear Credit picked up more of the residual share of the closing ICE Clear Credit than did LCH CDSClear.
Finally, 2024 EUR iTraxxSwaptions were split 72.1% at LCH CDSClear and 27.9% at ICE Clear Credit – continuing the trend away from the 99+% LCH CDSClear dominance in 2022.
Next, we come to JPY CDX and CDS.
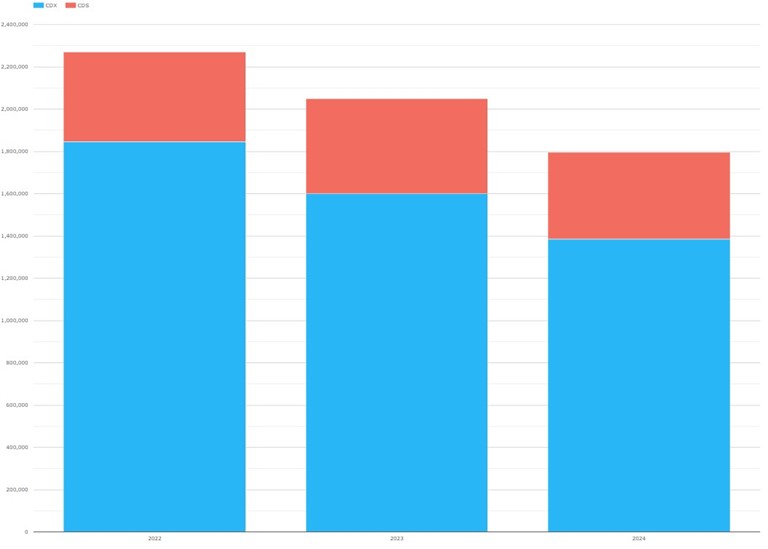
Chart 7 – JPY CRD Volumes by product type (JPY millions)
- JPY CDX volume in 2024 was ¥1.39 trillion, down from ¥1.60 trillion and ¥1.84 trillion in prior years.
- JPY single-name CDS were ¥412 billion, down from ¥451 billion and ¥426 billion.
- All the volume was at JSCC.
FX Derivatives Volumes
First, we look at FXD by Product Type: non-deliverable Forwards (NDFs), Options, Forwards and Spot.
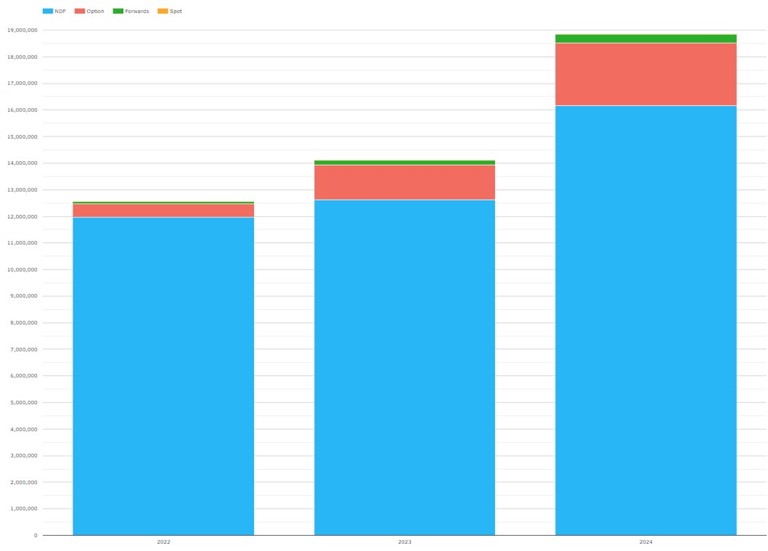
Chart 8 – Cleared FXD Volumes in USD millions
- NDFs were by far the largest with $16.2 trillion in 2024 up from $12.5 trillion, an increase of 22%.
- FX Options were $2.36 trillion, up from $1.31 trillion, an increase of 45%.
- Forwards were $136 billion, down from $324 billion.
- Spot was $10.5 billion, up from $4.6 billion.
Next, we view NDF by currency pair.
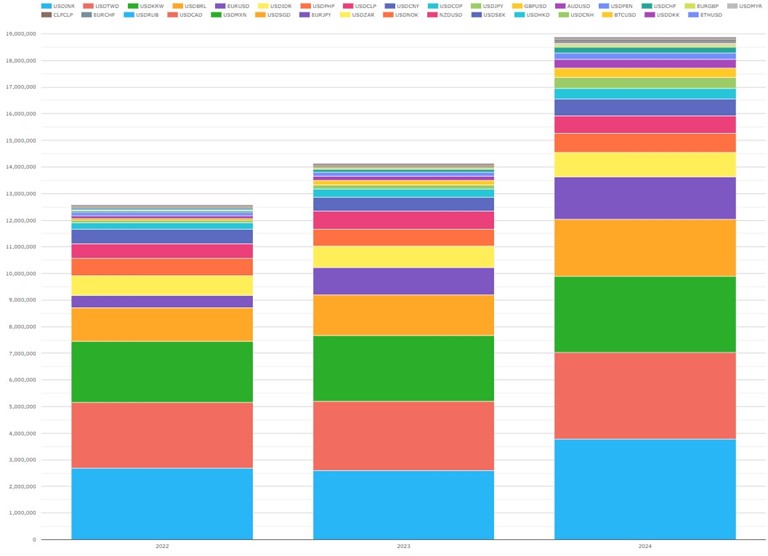
Chart 9 – NDF volumes by currency pair (USD millions)
- INR was the largest in 2024 with $3.77 trillion.
- TWD was next with $3.28 trillion.
- KRW was $2.84 trillion.
- BRL was $2.15 trillion.
- EUR was $1.59 trillion, making up the top 5.
Now, we look at NDF market share by CCP.
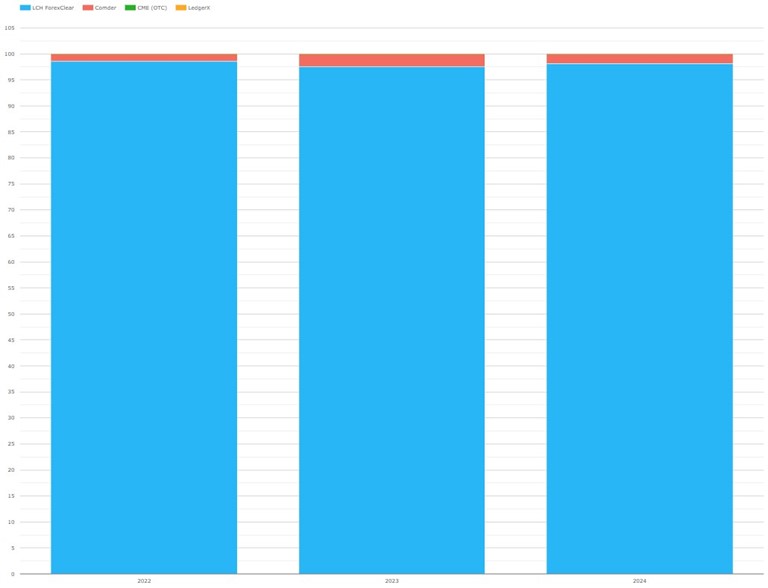
Chart 10 – Cleared NDF volume market share
- LCH ForexClear with $40.0 trillion and 98.1% share in 2024.
- Comder with $759 billion and 1.9% share.
- CME OTC with $23.4 billion and 0.1% share.
Now, we drill into FX Options by currency pair.
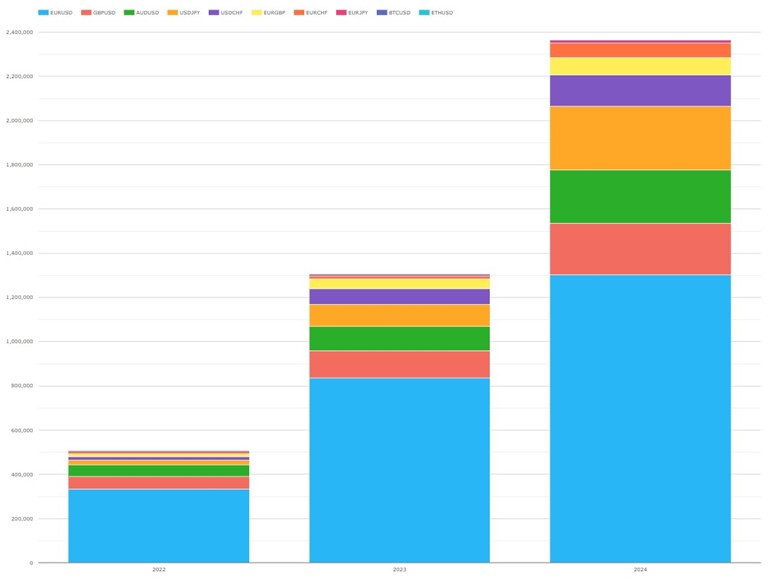
Chart 11 – Cleared FXO volumes in USD millions
All cleared FX options were $2,422 billion in 2024, up from 1,413 billion in 2023, an increase of 72%
- EURUSD was by far the largest with $1,303 billion, up from $835 billion, an increase of 56%.
- USDJPY was next $286 billion, up from $98 billion, an increase of 190%.
- AUDUSD was next with $241 billion, up from $111 billion, an increase of 117%.
- GBPUSD was next with $233 billion, up from $123 billion, an increase of 89%.
- FX Options volume was all at LCH ForexClear.
And a last chart before we end, the outstanding notional at year end for each currency pair.
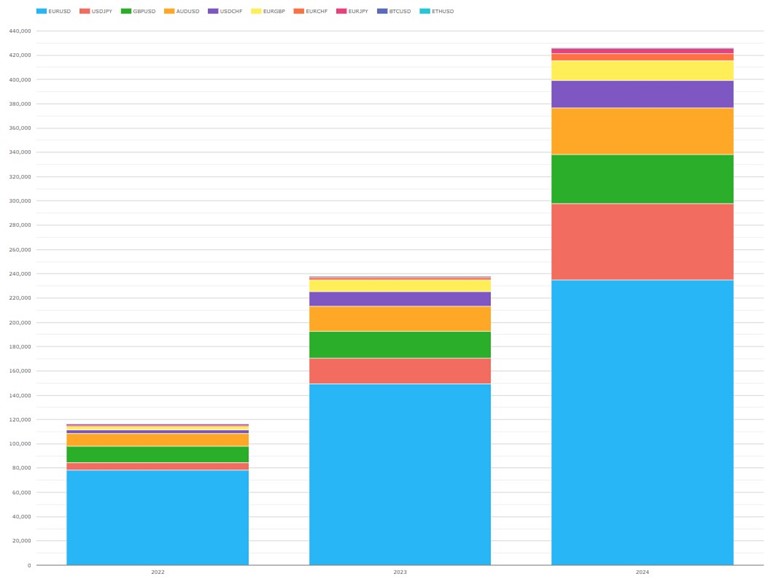
Chart 12 – Cleared FXO outstanding notional in USD millions
- Total Outstanding Notional at end 2024 was $426 billion, up from $238 billion in 2023, a 79% increase.
- EURUSD was largest with $235 billion, up from $150 billion and $78 billion in prior years.
- USDJPY was next with $62.6 billion, up from $20.9 billion and $6.0 billion.
- GBPUSD was $40.6 billion, up from $21.9 billion and $13.5 billion.
- AUDUSD was $38.5 billion, up from $20.9 billion and $10.9 billion.
That’s It
We used 7 charts to cover CRD and 5 to cover FXD.
There is a lot more data in CCPView:
- Daily, weekly, monthly, quarterly or annual plots.
- Volume, ADV, Open Interest, OI Change metrics.
- More granular data for CRD at Index Series or Single-name level.
Please contact us if you are interested in a subscription.