This blog reviews 2025 full-year swaption volumes, their split between on- and off-platform, and the market shares of platform groups.
We focus on the swaptions in the top four (G4) currencies using SDRView to aggregate volumes and trade count.
Key takeaways
For G4 swaptions in 2025 compared with 2023:
- 2025 saw the highest ever full-year SDR-reported notional volumes – up 35 percent from 2023, while full-year trade counts were flat versus 2023.
- A material part of the implied increases in reported trade size were caused by increases in reporting caps from October 2024 onwards.
- There was little change in the approximately 70:30 split of G4 swaptions volumes between off-platform (NA) and dealer-to-dealer (D2D) platforms.
- For D2D platform group G4 swaptions, market share shifted slightly toward ICAP and BGC and slightly away from TP, Tradition, and BrokerTec, which exited the product.
- D2D platform volumes were led by ICAP for USD, EUR, and GBP. JPY was evenly split between TP and Tradition. For G4 caps and floors, 2025 volumes and trade counts were flat compared with 2023. D2D platforms in combination lost share of total volumes versus off-platform trading.
Read on for the charts and data created in SDRView.
Volume context
2025 interest rate option volumes were split as follows.
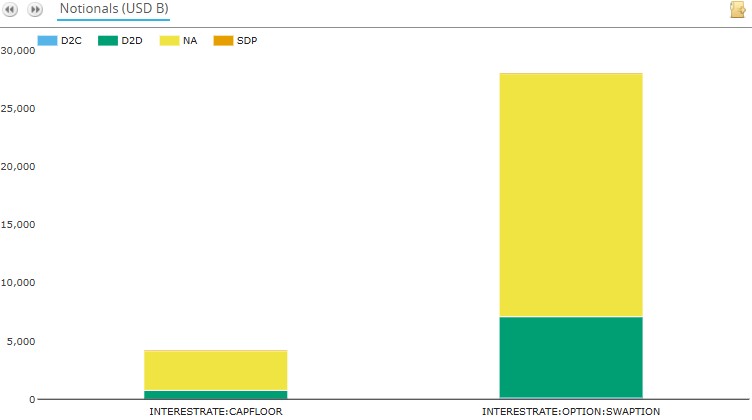
Chart 1: SDR-reported volumes of swaptions, caps and floors in all currencies by product and platform type (notional USD millions). Source: SDRView
Chart 1 shows that 2025 SDR-reported volumes of swaptions, caps, and floors in all currencies totaled $32.2 trillion, of which:
- Swaptions had the lion’s share, with $28.0 trillion.
- Caps and floors had $4.14 trillion.
- Multilateral D2D platforms made up 24 percent of the volume.
- Dealer-to-client (D2C) platforms saw regular Tradeweb-only swaptions activity totaling $83 billion. This is barely visible in the chart.
The activity was heavily focused on G4 currencies.
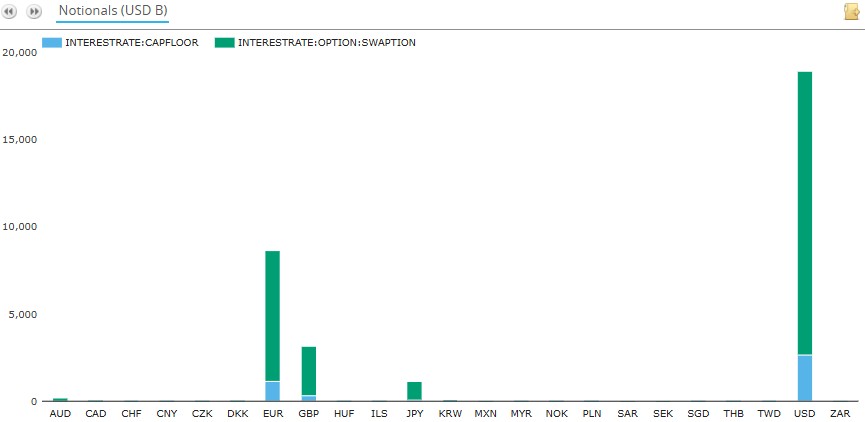
Chart 2: SDR-reported volumes of swaptions, caps, and floors by currency (notional USD millions). Source: SDRView
Chart 2 illustrates G4 currencies’ 99 percent share of SDR-reported volumes of swaptions, caps, and floors:
- USD was largest with $18.9 trillion (58.8 percent).
- EUR was next with $8.65 trillion (26.9 percent).
- GBP was next with $3.14 trillion (9.8 percent).
- JPY had $1.16 trillion (3.6 percent).
- The next four currencies (AUD, KRW, CAD, and ZAR) made up a further $272 billion (0.9 percent).
- The remaining 13 currencies (PLN, MXN, CZK, MYR, CNY, ILS, SAR, CHF, TWD, THB, SEK, HUF, NOK, DKK, SGD) made up a further $36 billion (0.1 percent).
We will focus on G4 currencies for the rest of this blog.
G4 currency swaption volumes
We start with notional volumes.
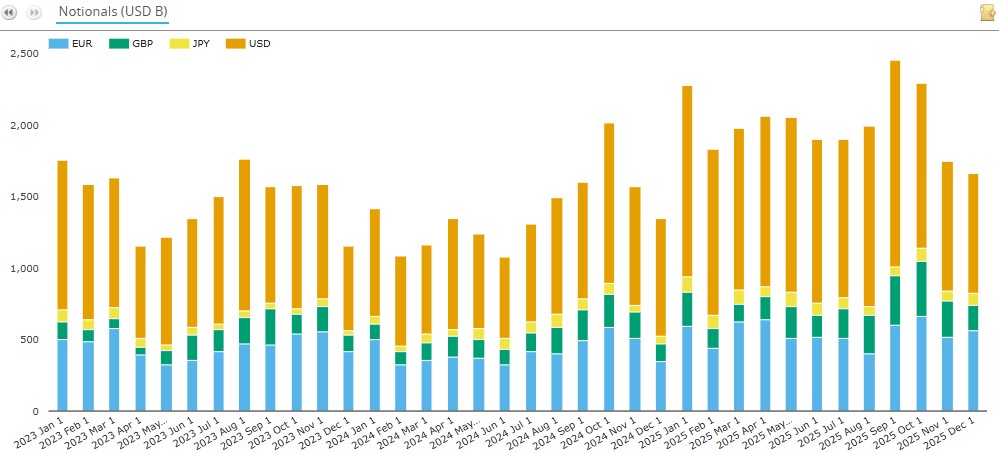
Chart 3: SDR-reported volumes of G4 swaptions by currency (notional USD millions). Source: SDRView
Chart 3 illustrates that full-year 2025 G4 swaptions volumes were their highest ever at $24.1 trillion – up 35 percent on 2023, the previous full-year high.
- USD had the highest volume with $13.9 trillion – up 53 percent on 2024, and up 38 percent on 2023.
- EUR came next with $6.56 trillion – up 31 percent on 2024, and up 20 percent on 2023.
- GBP was next with $2.68 trillion – up 52 percent on 2024, and up 63 percent on 2023.
- JPY completed the G4 picture with $982 billion – up 25 percent on 2024, and up 58 percent on 2023.
- Ranking currencies by volume growth percentage between 2023 and 2025: GBP was first, JPY second, USD third, and EUR fourth.
- Each month in 2025 exceeded the same month in both 2024 and 2023.
- Monthly volumes peaked at $2.45 trillion in September 2025 – their highest month ever, which beat the second and third highest of $2.27 trillion and $2.02 trillion in January 2025 and October 2024, respectively.
We can also look at the same activity by trade count.
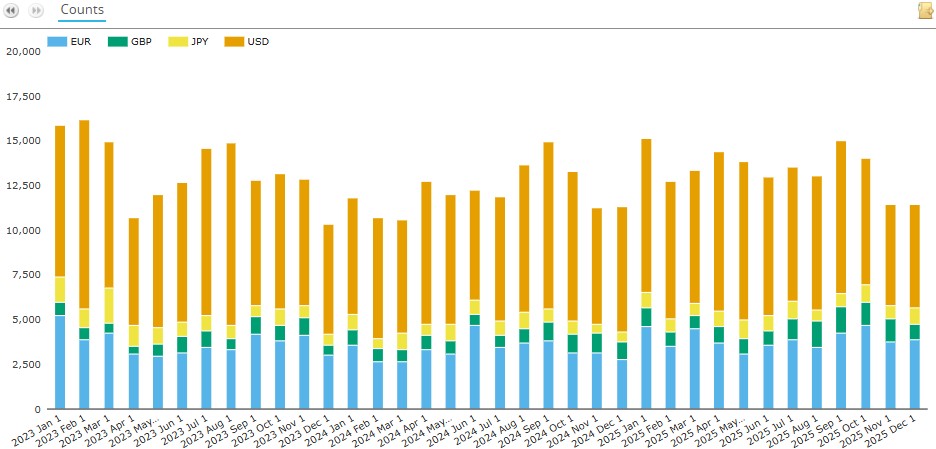
Chart 4: SDR-reported G4 swaptions activity by major currency (trade count). Source: SDRView
Chart 4 shows that SDR-reported G4 swaptions trade count in 2025 was 160,845 trades – up 9.8 percent from 2024 but flat compared with 2023.
- USD had the most trades with 91,270 – up 4.3 percent on 2024, but down 4.9 percent on 2023.
- EUR was next with 46,865 trades – up 17 percent on 2024, and up 5.6 percent on 2023.
- GBP came next with 12,667 trades – up 24 percent on 2024, and up 42 percent on 2023.
- JPY followed with 10,044 trades – up 14 percent on 2024, but down 15 percent on 2023.
- Ranking currencies by trade count growth between 2023 and 2025: GBP was first, JPY second, EUR third, and USD fourth.
Recapping: 2025 G4 swaption volumes were up 35 percent on 2023, while trade counts were flat over the same period. This suggests a closer look at trade sizes by currency.
Before that, I want to look at the impact of the reporting cap increases in October 2024.
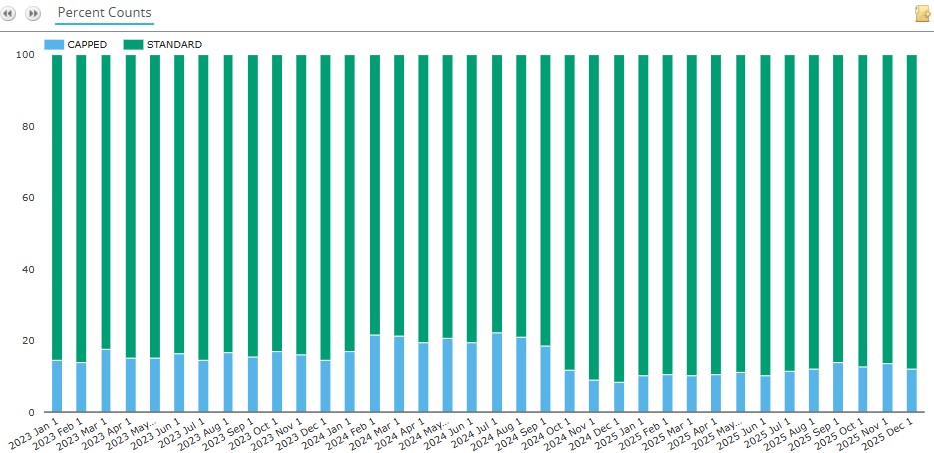
Chart 5: SDR-reported G4 swaptions activity shares by capped versus uncapped (percentage of trade count). Source: SDRView
Chart 5 shows the reduction in the capped share of trade counts from October 2024 onwards. As a percentage of total trade count, full-year capped trades were 15.5 percent in 2023, 17.5 percent in 2024, and 11.4 percent in 2025.
Now we look at average trade sizes, which we created offline by dividing notional by trade count.
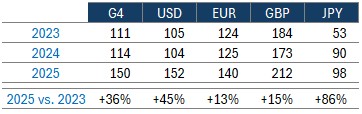
Table 1: SDR-reported G4 swaptions average trade size (notional USD million). Source: SDRView
Table 1 shows us that G4 swaptions average trade size was $150 million in 2025 – up 36 percent from 2023, the last full year before the reporting cap increase. The bigger currency-level percentage trade size increases for USD and JPY compared with EUR and GBP reflect the bigger increases in reporting caps in those two currencies.
For an example of the impact on reporting caps on reported trade notional, imagine the same trade being executed twice – once in 2023, once in 2025. There is no difference in actual traded notional between 2023 and 2025. If the trade notional is above both current and prior reporting caps for that currency and tenor, the 2025 reported notional will be higher than the 2023 reported notional by the amount of the reporting cap increase. Hence, SDR-reported notional volumes increase when the actual trading volume did not (because there was one trade of the same size in both 2023 and 2025). Unfortunately, we do not have the full notional of capped trades, so we cannot precisely attribute the increases in trade size between reporting cap increases and actual trade size increases.
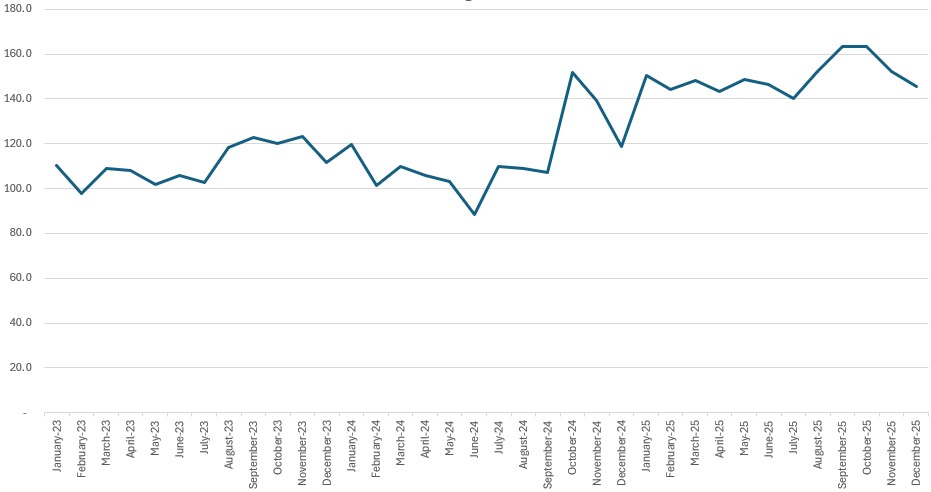
Chart 6: SDR-reported G4 swaptions average trade size (notional USD million). Source: SDRView
Chart 6 shows that G4 swaptions average trade sizes were steady around $150 million in and after October 2024, the first month of the new SDR-reporting caps. They were also steady at around $110 million in and before September 2024. This suggests that the reporting cap increases were a major part of the average trade size increases in Table 1.
In summary, 2025 trade counts were flat compared with 2023, so notional volume increases over the same period were driven by trade size increases. These in turn were partly driven by the reporting cap increases.
On vs off platform
What is the trend here?
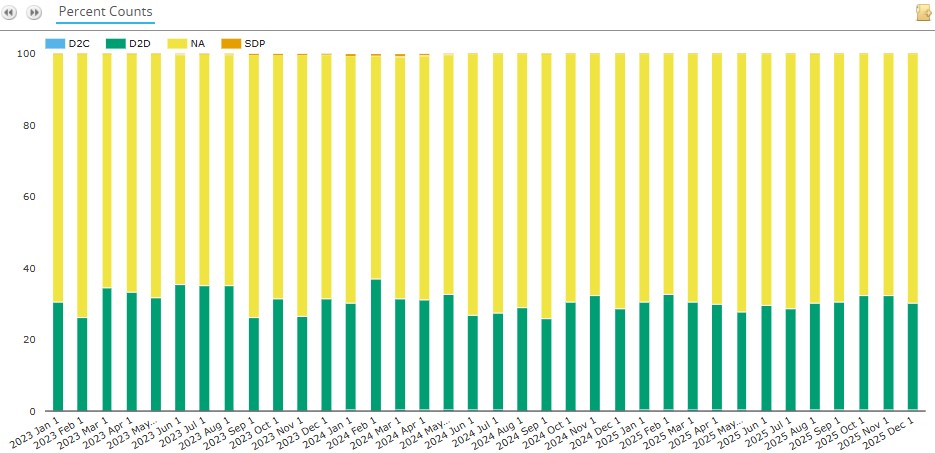
Chart 7: SDR-reported G4 swaptions volume shares by platform type (percentage of trade count). Source: SDRView
Chart 7 shows the steady 70:30 split of G4 swaptions between off-platform (NA) and D2D platforms. For the whole of 2025:
- Off-platform activity averaged 69.6 percent in 2025, 69.6 percent in 2024, and 68.4 percent in 2023.
- D2D platforms averaged 30.1 percent in 2025, 30.0 percent in 2024, and 31.4 percent in 2023.
- D2C platforms averaged 31 trades per month in 2025, 25 in 2024, and 3 in 2023 (all Tradeweb).
D2D market share
We move on to look at D2D platform market shares. Here we exclude compression packages, whose volumes are dominated by IM optimization activity, to focus on swaptions risk-trading.
We also use package-adjusted trade counts. These eliminate the multiple-counting of trades for multi-legged packages. They also avoid the effect of reporting cap increases in late 2024 in metrics based on notional and DV01.
The result is that we focus on platforms’ share of individual trade execution events.
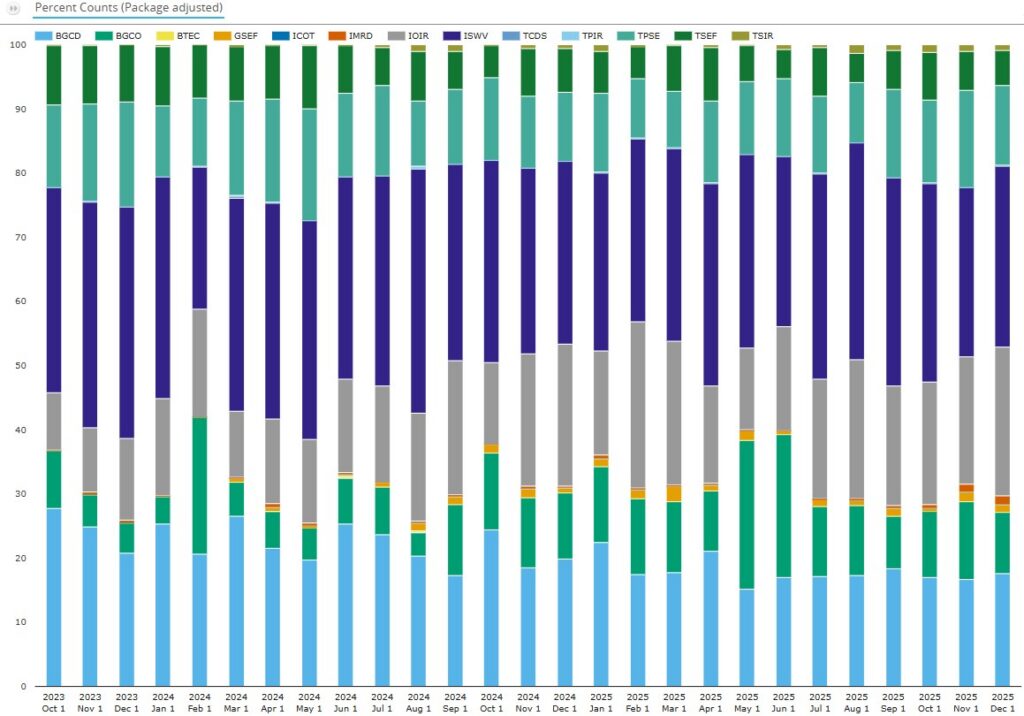
Chart 8: Share of SDR-reported D2D platform G4 swaptions execution events by platform (percentage of package-adjusted trade counts excluding compression packages). Source: SDRView
As noted in our prior blog Rates IM optimization, almost all BGCO’s swaptions volume shown in the chart above comes from IM Capitolis optimization runs. We exclude BGCO from the full-year share figures shown below.
We calculate that 2025 full-year shares of G4 swaptions risk-trading execution events by platform group were as follows.
- ICAP (mainly ISWV and IOIR) led with 56.5 percent – up YoY from 52.4 percent.
- BGC (BGCD and GSEF only) had 21.9 percent – down YoY from 24.7 percent.
- TP (mainly TPSE) had 14.4 percent in 2025 – down YoY from 14.6 percent.
- Tradition (TSEF) saw 7.1 percent – down YoY from 8.2 percent.
- CME’s BrokerTec (BTEC) had no share – down YoY from 0.068 percent.
In summary, in 2025 ICAP gained 4.1 percent, BGC lost 2.8 percent, TP lost 0.2 percent, and Tradition lost 1.1 percent. You can find more reference information about each platform by Googling “MIC code XXXX” where XXX is the platform ID above.
Now let’s have a look at the platform shares at currency level.
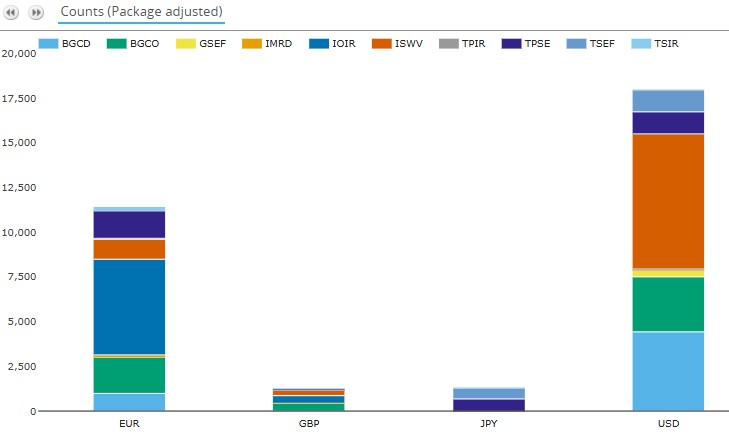
Chart 9: D2D platform 2025 G4 swaptions by currency and platform (package-adjusted trade count excluding compression packages). Source: SDRView
Chart 9 shows that in 2025 (ignoring BGCO volumes as explained above):
- USD was led by ICAP (ISWV), then BGC (BGCD), then TP (TPSE), then Tradition (TSEF).
- EUR was also led by ICAP (IOIR and ISWV), then TP (TPSE and TSIR), then BGC (BGCD).
- GBP was also dominated by ICAP (IOIR and ISWV).
- JPY was evenly split between TP (TPSE) and Tradition (TSEF).
Caps and floors
At $4.14 trillion, caps and floors are a niche product but not insignificant. I took a spin through the charts for caps and floors corresponding to the preceding charts for swaptions. Rather than elaborate chart-by-chart, a three-bullet summary of 2025 G4 currency caps and floors activity may suffice:
- SDR-reported notional volumes were $4.11 trillion, trade counts were 19,226, and average trade size was $214 million – all flat compared with 2023.
- D2D platforms’ share of full-year volumes was 11.5 percent – down from 15.8 percent in 2023.
- Tradition’s leading share of D2D platform package-adjusted trade count declined to 32.4 percent from 45.2 percent in 2023; ICAP had 24.5 percent – up from 14.5 percent; BGC had 23 percent – up from 17.6 percent; and TP had 20.1 percent – down from 22.7 percent.
End note
Skip back to the top to reread the key takeaways if you like.
We used nine charts and one table for a complete overview, but there is a lot more data in SDRView.
Please contact us for information on the data products, or for more details on any of the above analysis.